

Reporter's notebook: What's behind spikes in COVID case, death numbers in Minnesota's latest data release?

Go Deeper.
Create an account or log in to save stories.
Like this?
Thanks for liking this story! We have added it to a list of your favorite stories.
Minnesota's daily COVID-19 data release included several anomalies Tuesday, but the issue didn’t stem from something that the state Department of Health did — or, at least, not directly.
Rather, four private testing labs apparently didn't report 37,350 COVID-19 test results — including 891 that were positive — to the department over a period of months. Most of those tests came from people in long-term care facilities. And those 891 unreported cases meant that 22 hospitalizations and 138 deaths in Minnesota weren't classified as being connected COVID-19 — until Tuesday.
The Health Department uncovered the unreported cases, hospitalizations and deaths during an audit. The four labs are currently under state investigation and may face civil fines of up to $10,000; the department said they wouldn't identify the labs until that investigation is complete.
In a press briefing Tuesday, officials took pains to say that every patient whose cases were represented by those unreported cases got the treatment they needed at the time. In other words, according to health officials, the data issue is more of an annoyance for people tracking the COVID-19 numbers in Minnesota than a problem for the state’s response to the outbreak.
Turn Up Your Support
MPR News helps you turn down the noise and build shared understanding. Turn up your support for this public resource and keep trusted journalism accessible to all.
But when the anomaly was announced Tuesday, the data was incorporated into a series of COVID-19 daily data releases — which created a maximal annoyance for people tracking the numbers.
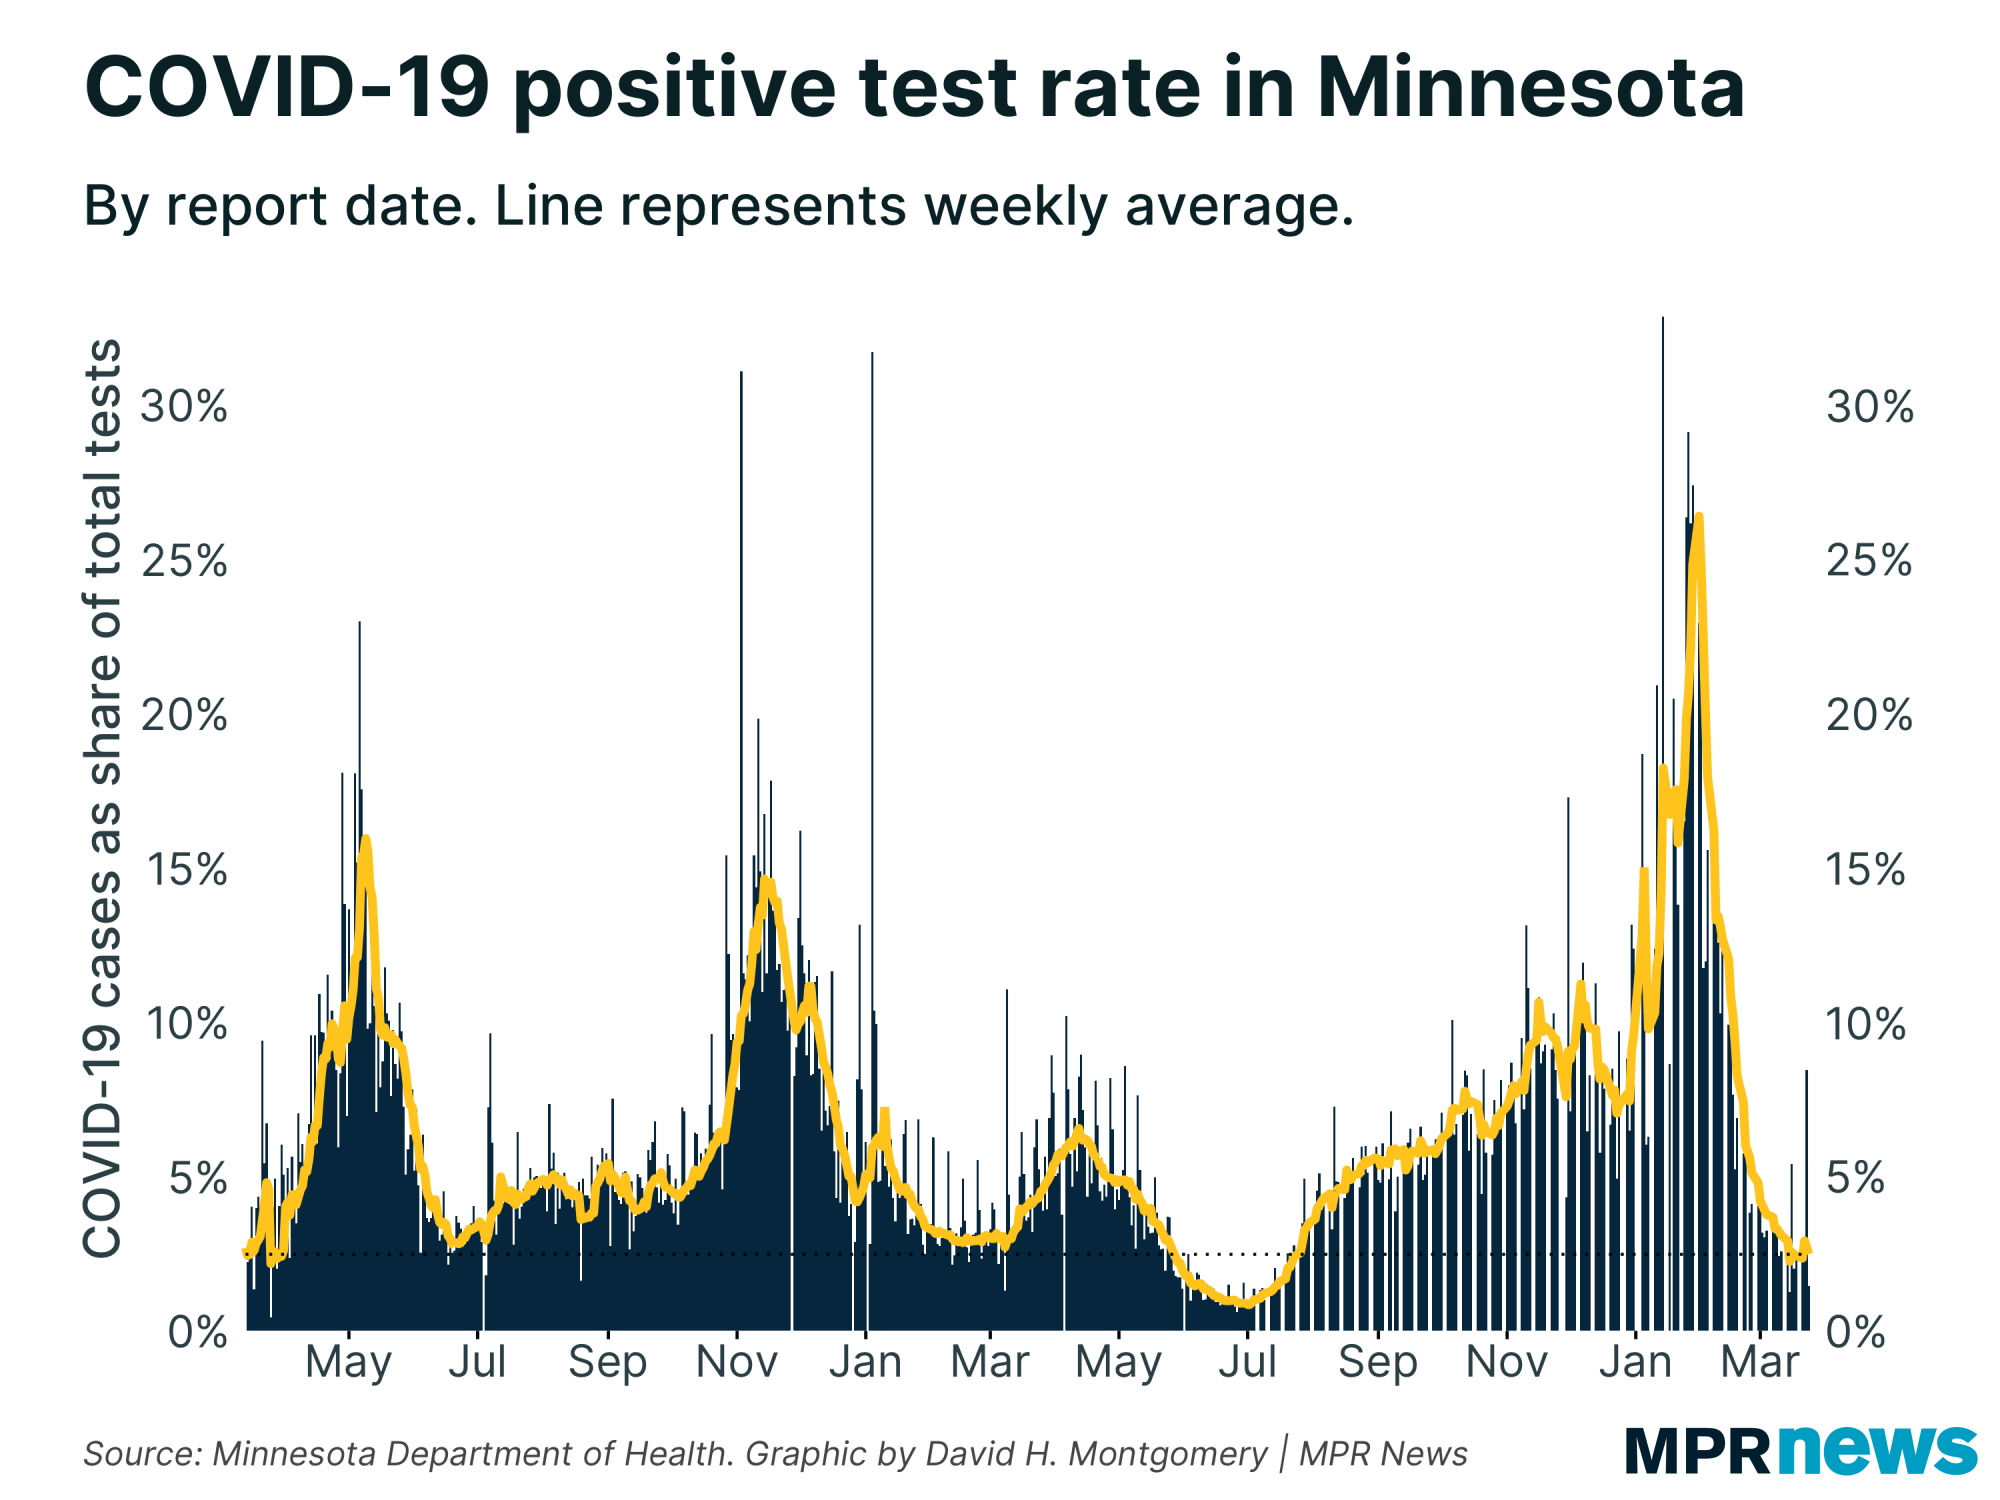
First, the negative tests from these four labs were published last week, but the positive tests didn't show up in the data until Tuesday. That means positivity rate calculations are haywire — all those negative tests last week made the positivity rate look as though it was really low, while the positive tests on Tuesday made it shoot up.
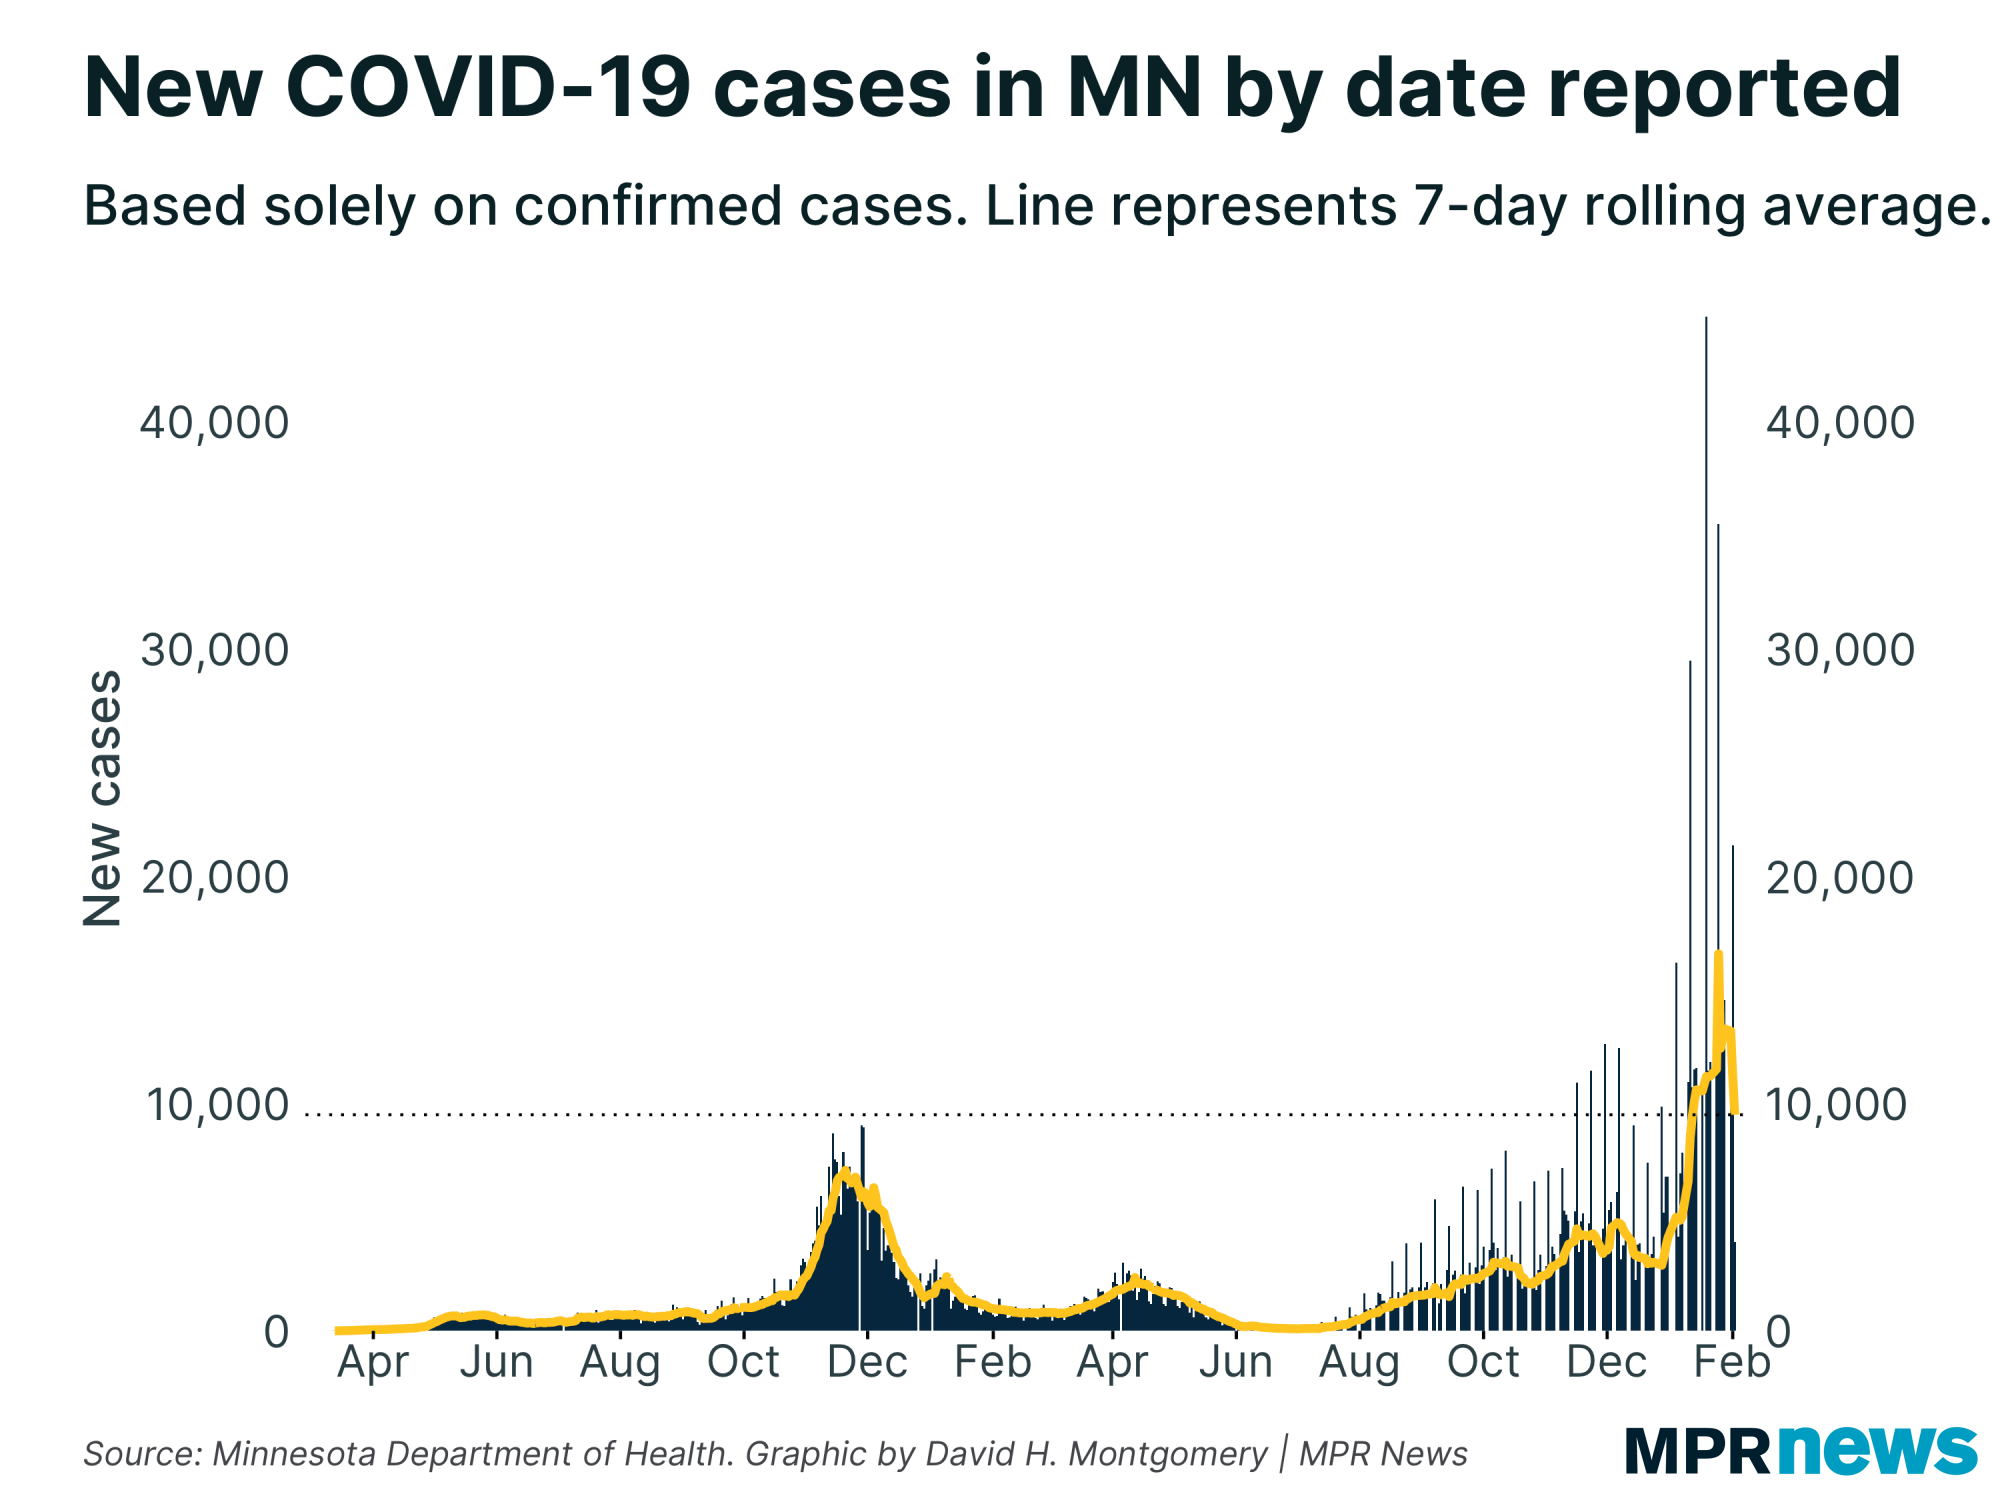
This isn't such a huge deal for two of the statistics we track: Newly reported cases and new hospital admissions. For both, we get data according to the date the event actually occurred. That means it's pretty easy to adjust, since these cases, and the deaths associated with them, were spread out over a number of months.
But the Minnesota Department of Health only reports deaths and negative tests by the date they were reported, not the date they occurred. Deaths from COVID-19 eventually appear on the date they actually happened, but in a separate dataset that is only available for purchase, and takes weeks to fill in.
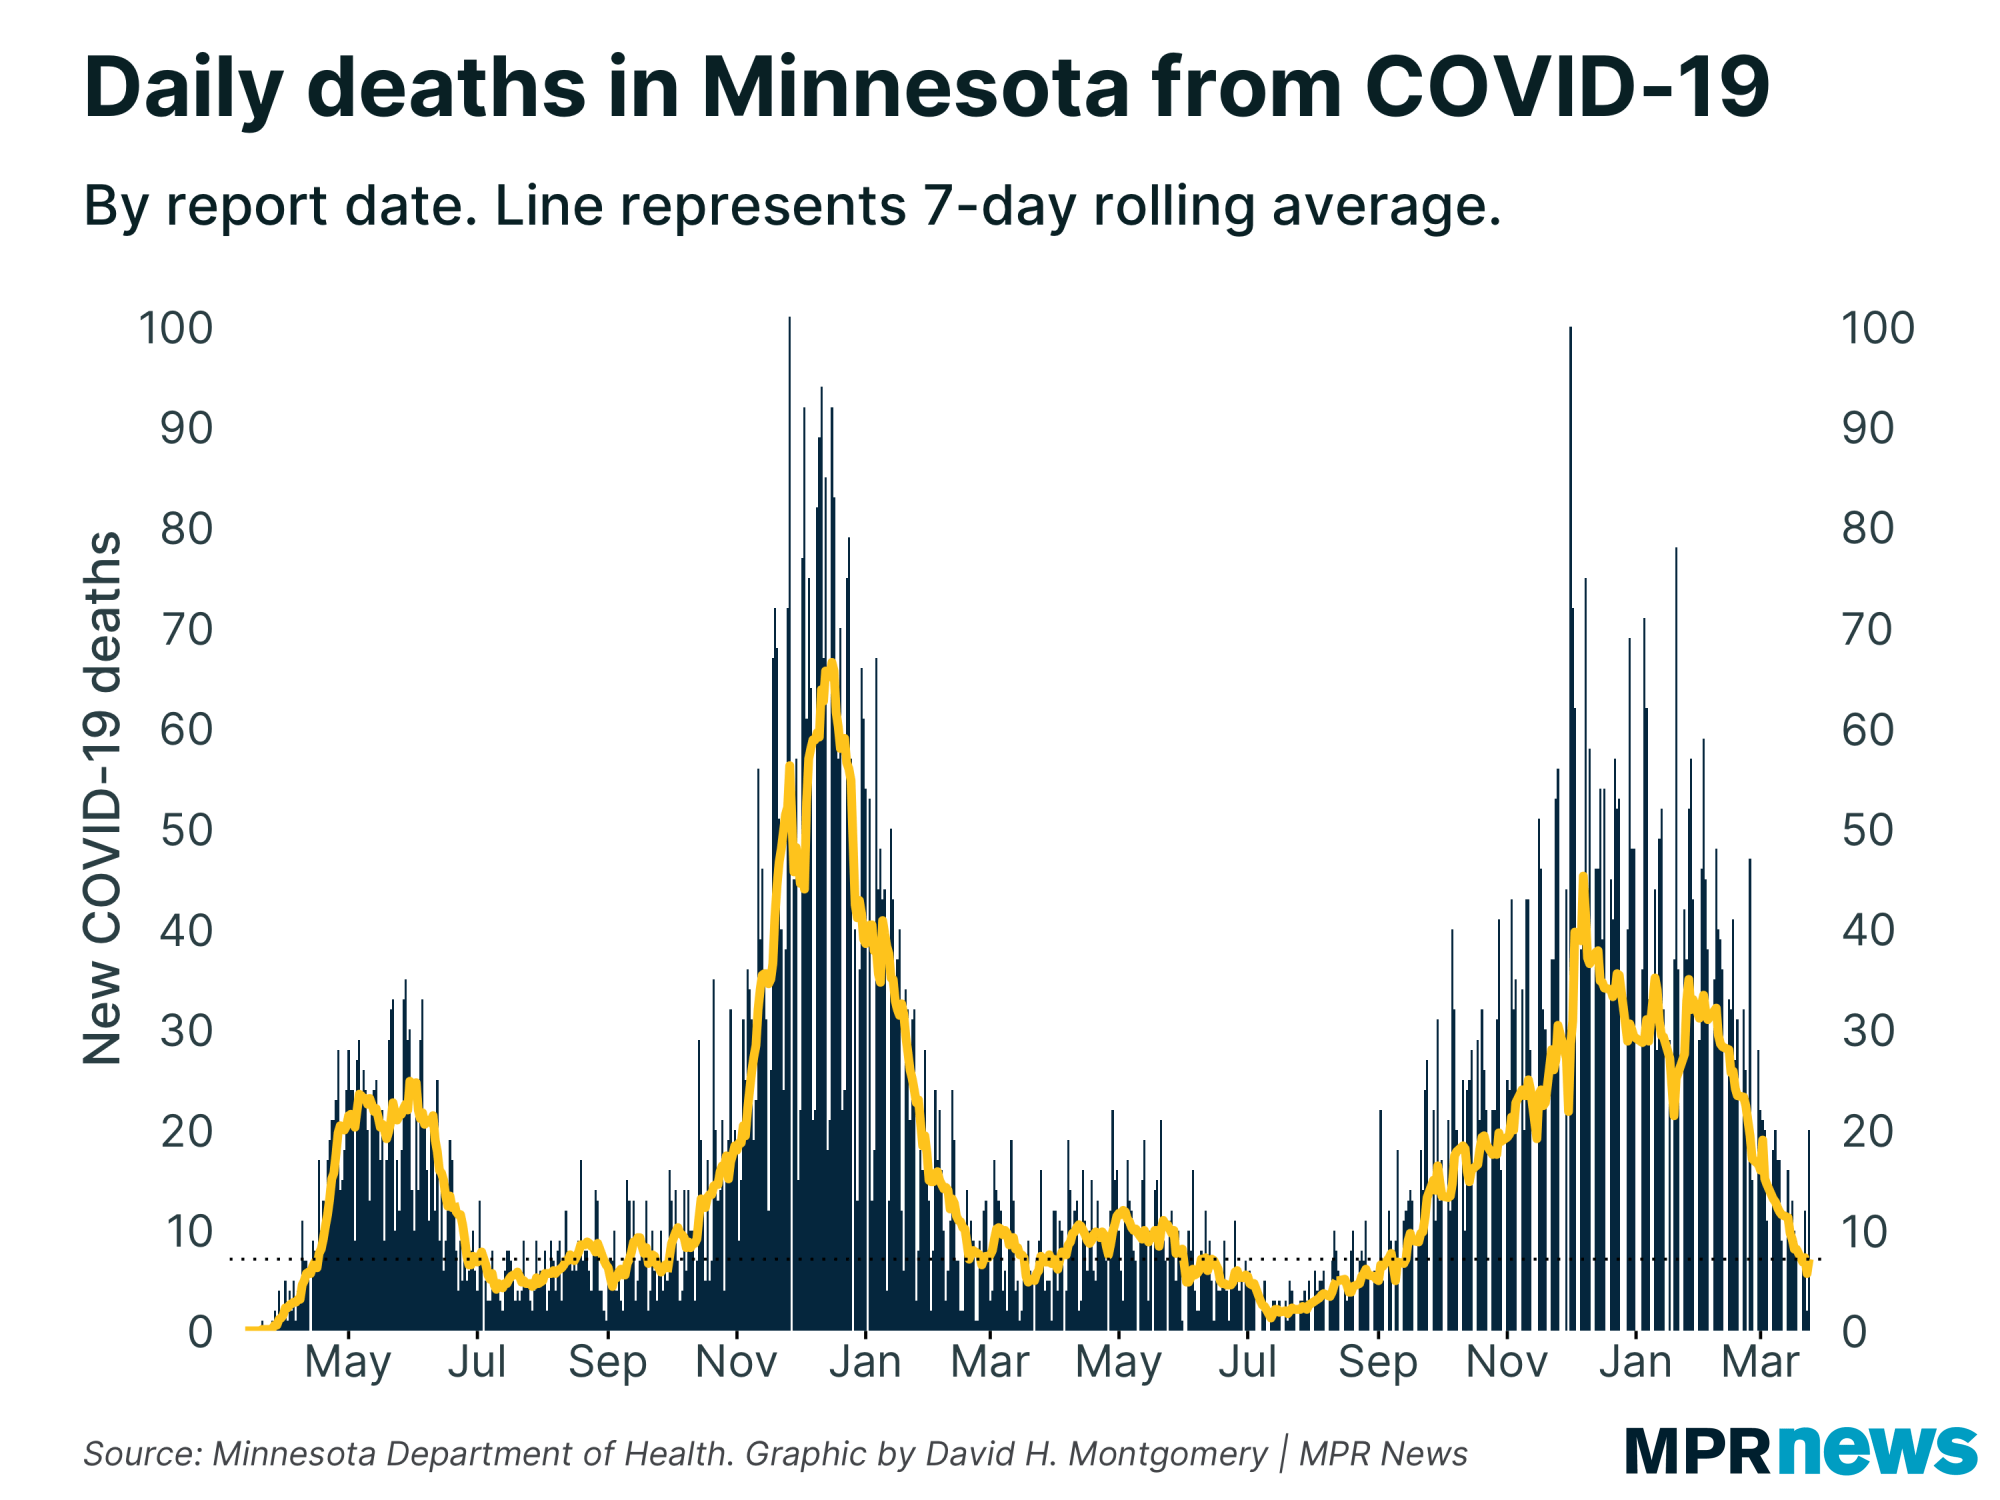
That means that an observer looking at the data in a hurry might think that we just saw the single deadliest day of the pandemic so far, with nearly 140 new deaths.
The actual story here is less dramatic, if you remove the backlogged data from the report entirely. Instead of massive, sometimes chart-breaking spikes Tuesday, everything is pretty much flat.
Positivity rate is also pretty flat — we saw a bit of a one-day spike, but on a tiny testing volume. The rolling seven-day average is holding pretty steady around 3 percent.
But this crude math, subtracting out these backlogged cases from the data, shouldn't be necessary. Many states report COVID-19 deaths by the day they happened. Minnesota has that data available; it just made a decision early on to publish deaths by report date, and — subject to staffing constraints — hasn't changed course.
The Health Department also doesn’t report its testing data by the date the sample was taken — even though it uses that data to calculate its positivity rates.
The state's dashboard shows a rolling average positivity rate calculated by dividing cases-by-sample-date over tests-by-sample-date. That means adding a bunch of old cases into the mix doesn't create a one-day spike in positivity rate, but is distributed on the days the tests actually occurred and should have been reported.
But ordinary people, or reporters at news organizations, can't recreate this data, because Minnesota doesn't publish test data by the date the sample was taken. All outsiders can calculate is positivity rate by date reported, which is subject to wild distortions whenever significant numbers of months-old cases or tests enter the mix.
It's possible to make rough fixes to avoid misleading people, such as subtracting out the backlogged cases and deaths from Tuesday’s data. But that still leaves messy data under the hood, such as an apparent surge in older Minnesotans with COVID-19 Tuesday that actually just reflects a bunch of tests from November and December.