

Reporter’s notebook: Understanding COVID-19 case rates over time

Go Deeper.
Create an account or log in to save stories.
Like this?
Thanks for liking this story! We have added it to a list of your favorite stories.
On Monday — Nov. 9 — Minnesota reported 3,930 new confirmed cases of COVID-19.
Is that bad? Is it OK? How should we interpret those numbers? Figuring it out can be difficult.
One approach I use to help put COVID-19 figures in context is to make a rough translation into personal risk. How likely would I be to get infected, if the disease were to continue spreading at its current rate for an extended period of time?
I’m going to explain how I calculate that here.
Turn Up Your Support
MPR News helps you turn down the noise and build shared understanding. Turn up your support for this public resource and keep trusted journalism accessible to all.
Keep in mind: That “extended period of time” bit is key. As a share of the population, each day’s COVID-19 stats can seem pretty small. For example, Minnesota’s 3,930 cases Monday account for 0.070 percent of the state’s 5.64-million person population.
But the costs of COVID-19 aren’t a one-off disaster, like a bad storm. The disease has been spreading for months, and is likely to last for months more. So to get a proper sense of its impact, we need to think of that daily risk as one that repeats. At current rates, how much of the state would be infected after a year?
It’s important to note that what follows is just math — a different way of interpreting the numbers. It doesn’t account for a whole host of factors that are relevant when considering risk and the spread of COVID-19 in real life.
Among other factors, this method uses a single rate of spread for the whole population of Minnesota, but at any given time, the disease is spreading faster in certain regions and among certain demographics. The number of confirmed cases misses some people who never get tested for the disease. And the idea of an infection rate staying the same over a full year is simply a mental exercise, since of course in real life the spread of a disease such as COVID-19 increases and decreases over time.
Moreover, in real life, these odds for a population level are affected by individual behavior. Someone who exercises maximum precautions might have a personal risk that’s lower than the general population’s overall risk, while someone who takes few precautions might be at an elevated risk.
All of that considered, these calculations allow us to better understand the magnitude of those daily numbers.
Calculating the mathematical odds
Here’s how to convert the current rate of new COVID-19 infections into a general, yearly risk of infection. This takes a little bit of math, but not too much.
First: It’s best to use a trend rather than a one-day average, to smooth over any outliers. Minnesota reported 3,930 on Nov. 9, but over the previous seven days, it had reported an average of 4,463 cases per day.
Start with the chance of something happening once. In this case, that’s 4,463 cases out of 5,639,632 people, or 0.079 percent.
Convert that into the chance that DOESN’T happen: 100 percent minus 0.079 percent equals 99.921 percent.
Multiply that number by itself, a number of times equal to the length of time for which you want to calculate the cumulative odds. In other words, remember exponents? Raise that percentage to the power of the length of time we’re calculating for.
For example: Something that has a 60 percent chance not happening once has a 36 percent of not happening on two days, because 0.6^2 = 0.36. That same thing has a 21.6 percent chance of not happening over three days, because 0.6^3 = 0.216.
In the case of the COVID-19 odds, we need to multiply 99.930 percent by itself 365 times — 0.999^365 power — which yields a 74.906 percent chance that any one individual wouldn’t get sick at the current rate of infection.
To find the odds that you would get sick, you subtract the odds that you wouldn’t get sick from 100 percent. In this case: You’d have a 25.094 percent chance of getting sick at the current rate of infection.
To be clear: This back-of-the-envelope technique involves a whole lot of simplifications and assumptions. Among many others, the current rate of infection misses some sick people who don’t get tested, and infection rates don’t stay at one level for a full year, but fluctuate up and down.
The point is to get another perspective on what a daily rate of cases really means, given the size of the population and the likelihood that the outbreak will last for a while.
Consider this chart, showing new cases per day over the course of the outbreak:
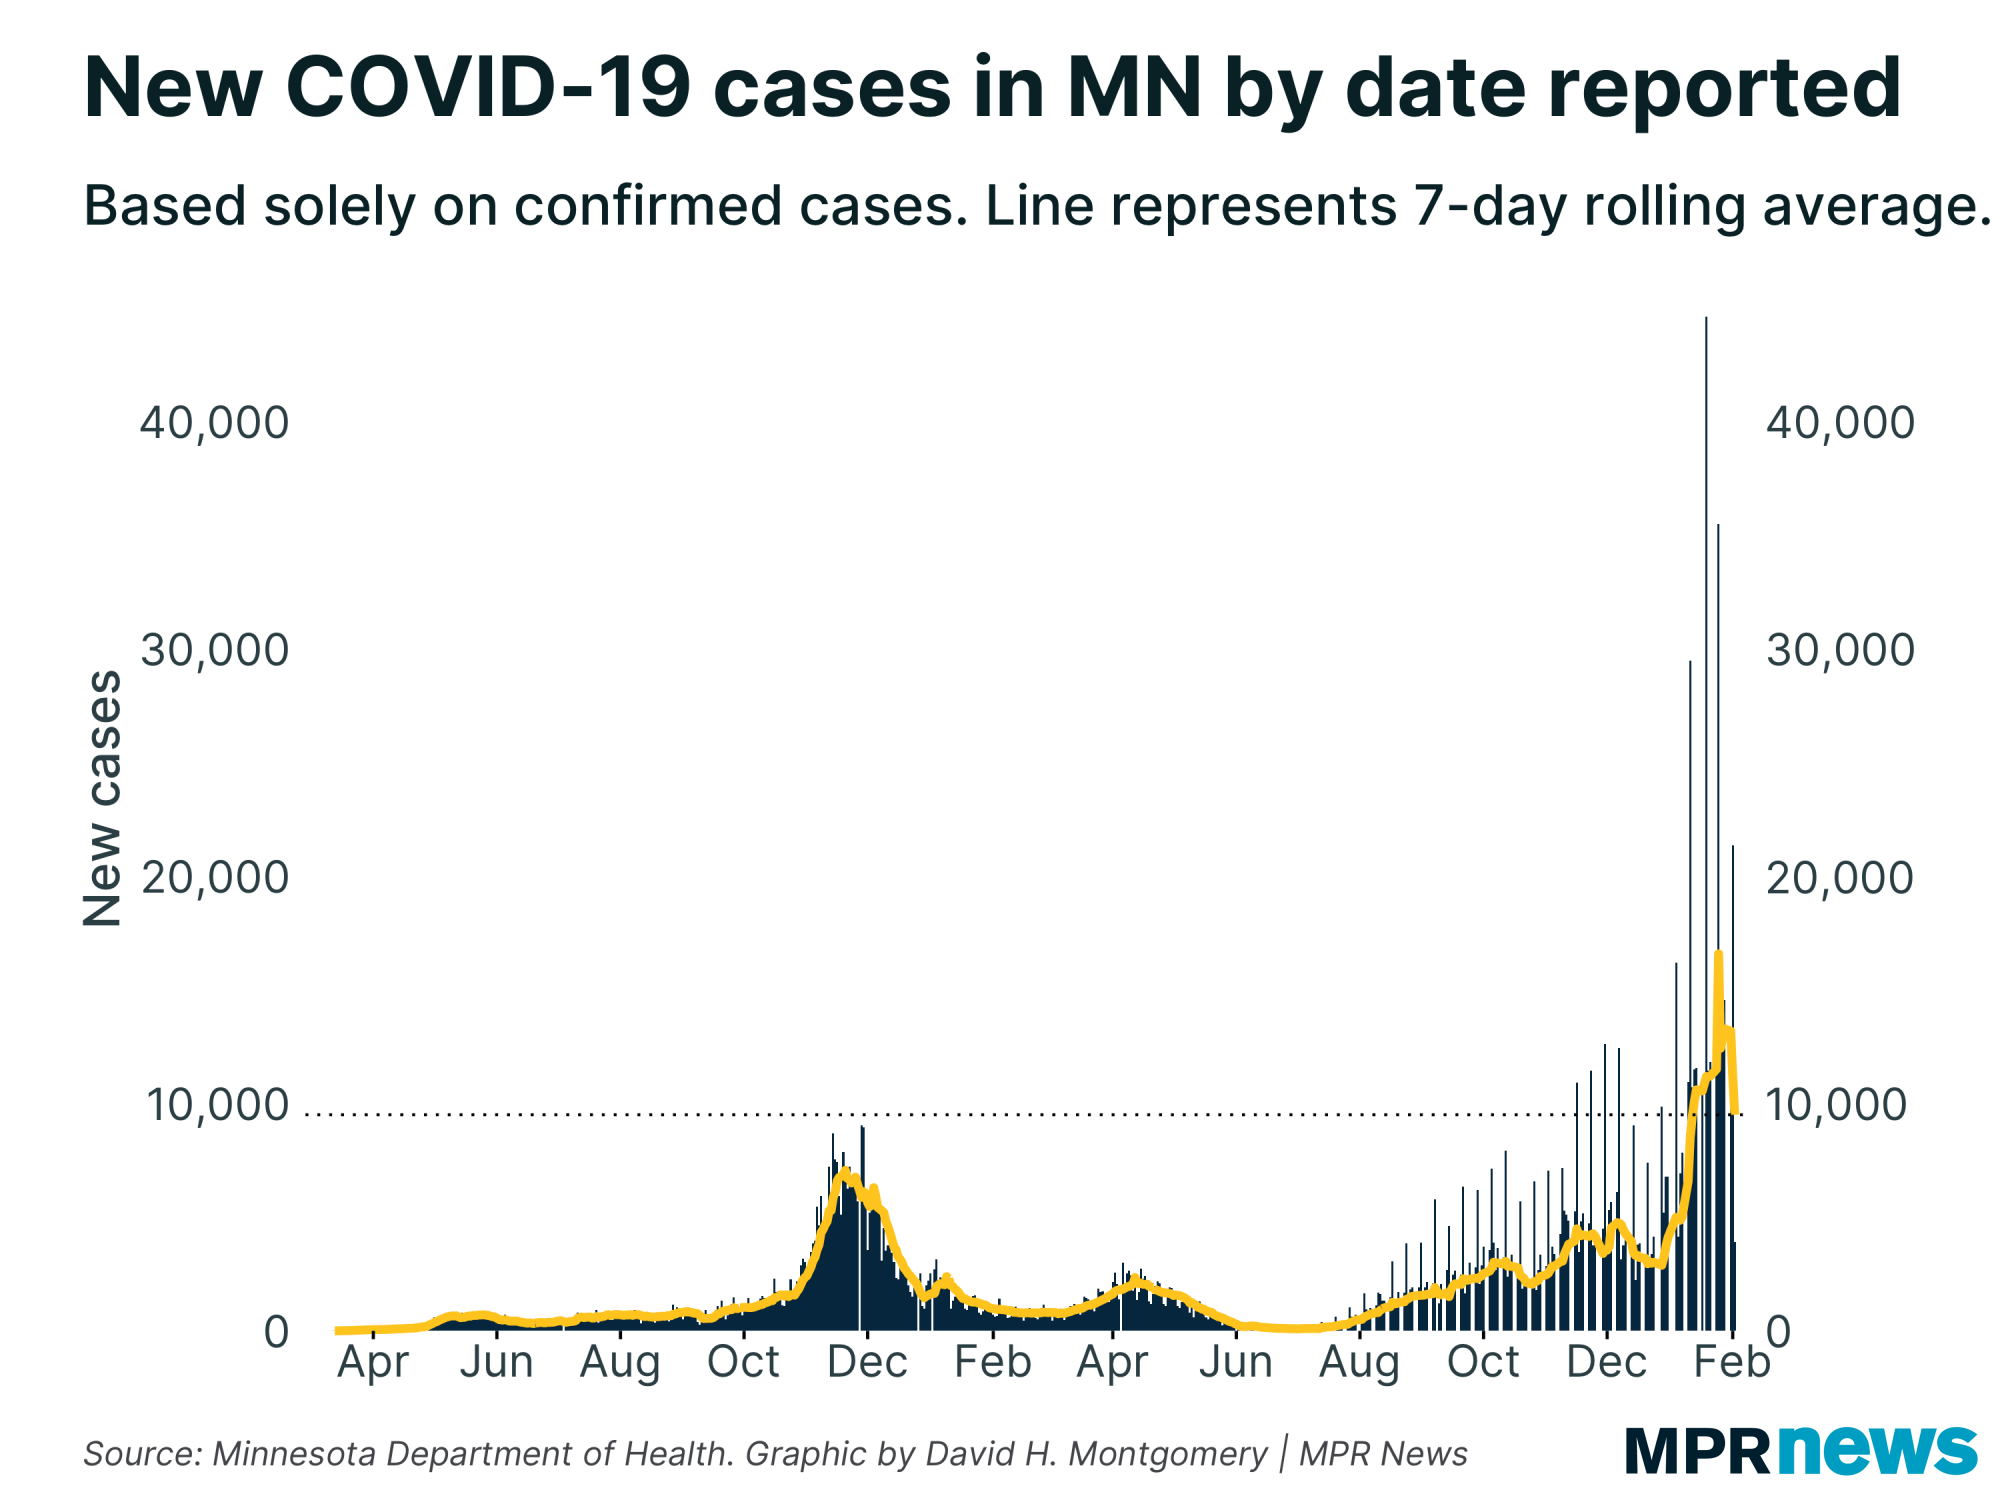
The same data used to create this chart could be reinterpreted a different way: As the (rough) odds that an individual would catch COVID-19 if current rates continued for a full year. The current seven-day average rate of 4,463 cases per day, with this technique, could be expressed as a 25.1 percent chance — or about 1 in 4 odds — of catching the disease over the course of the year.

Now, whether 1 in 4 odds sound like a lot or a little depends on what you compare it to. It’s currently greater than the old odds in Minnesota from a month ago, which were about 1 in 14.
Another good comparison is how Minnesota’s odds compare to other states. Right now, Minnesota’s 1 in 4 odds are smaller than than Wisconsin’s odds of about 1 in 3, and currently rank best out of its neighbors, all five states in the Upper Midwest.

You might also think that annual odds aren’t the best way to understand the risk of COVID-19, since the disease is unable to persist at a constant rate for a full year. But 2020 has shown that outbreaks regularly last a month or more. So what do these odds look like over 30 days, rather than 365?
These 30-day figures are unsurprisingly lower than 365-day estimates, since there’s less time to be infected. Over 30 days, Minnesota’s current rate of 3,930 cases per day would translate to about 1 in 43 chance of catching COVID-19 over the past month, or about 2.35 percent. That’s greater than last month’s 1 in 162 odds of catching COVID-19 over 30 days.

If you’d like to see how this math works for any combination of case rates, you can use this calculator below to find out. Just input the current number of cases (whether a daily number or — even better — a seven-day average), the population of the area you’re comparing it to, and the number of days for which you want to calculate odds.
Refresh the page if you don’t see the calculator widget below.
COVID-19 in Minnesota
Data in these graphs are based on the Minnesota Department of Health's cumulative totals released at 11 a.m. daily. You can find more detailed statistics on COVID-19 at the Health Department website.
The coronavirus is transmitted through respiratory droplets, coughs and sneezes, similar to the way the flu can spread.