Update: Comparing COVID-19 in Minnesota and its neighbors in the Upper Midwest

Go Deeper.
Create an account or log in to save stories.
Like this?
Thanks for liking this story! We have added it to a list of your favorite stories.
Updated: Jan. 28, 2021 | Posted: March 17, 2020
MPR News will continue to provide updated information as fresh data becomes available.
How does the COVID-19 outbreak in Minnesota compare to its neighboring states in the Upper Midwest? Because of how COVID-19 is being tracked, this isn’t an easy question to answer.
In terms of raw numbers, Minnesota, Wisconsin and Iowa have typically reported far more cases than North and South Dakota.

But 100 new cases would mean something very different in a more populous state like Minnesota or Wisconsin than it would in a state with fewer residents like North or South Dakota. Here is a look at COVID-19 cases per million residents.
Turn Up Your Support
MPR News helps you turn down the noise and build shared understanding. Turn up your support for this public resource and keep trusted journalism accessible to all.

At certain times in the outbreak, COVID-19 has grown much faster in some of the region’s smaller states, adjusting for population, than it was in larger states with more total cases.
All of these figures exist in an unusual circumstance, however. For months, tests remained in short supply, with many people who wanted to get tests unable to do so. Minnesota’s testing rates have increased at the end of June when state officials announced that they had finally reached its “moonshot” capacity to test 20,000 people per day.
These case figures don’t reflect the number of people who may have COVID-19; they only reflect the current number of people who have tested positive. A state that tests fewer people for coronavirus will get fewer positive results, but that doesn’t mean it has fewer people with the disease. So, looking at how much a state is testing can help interpret what its case numbers mean:

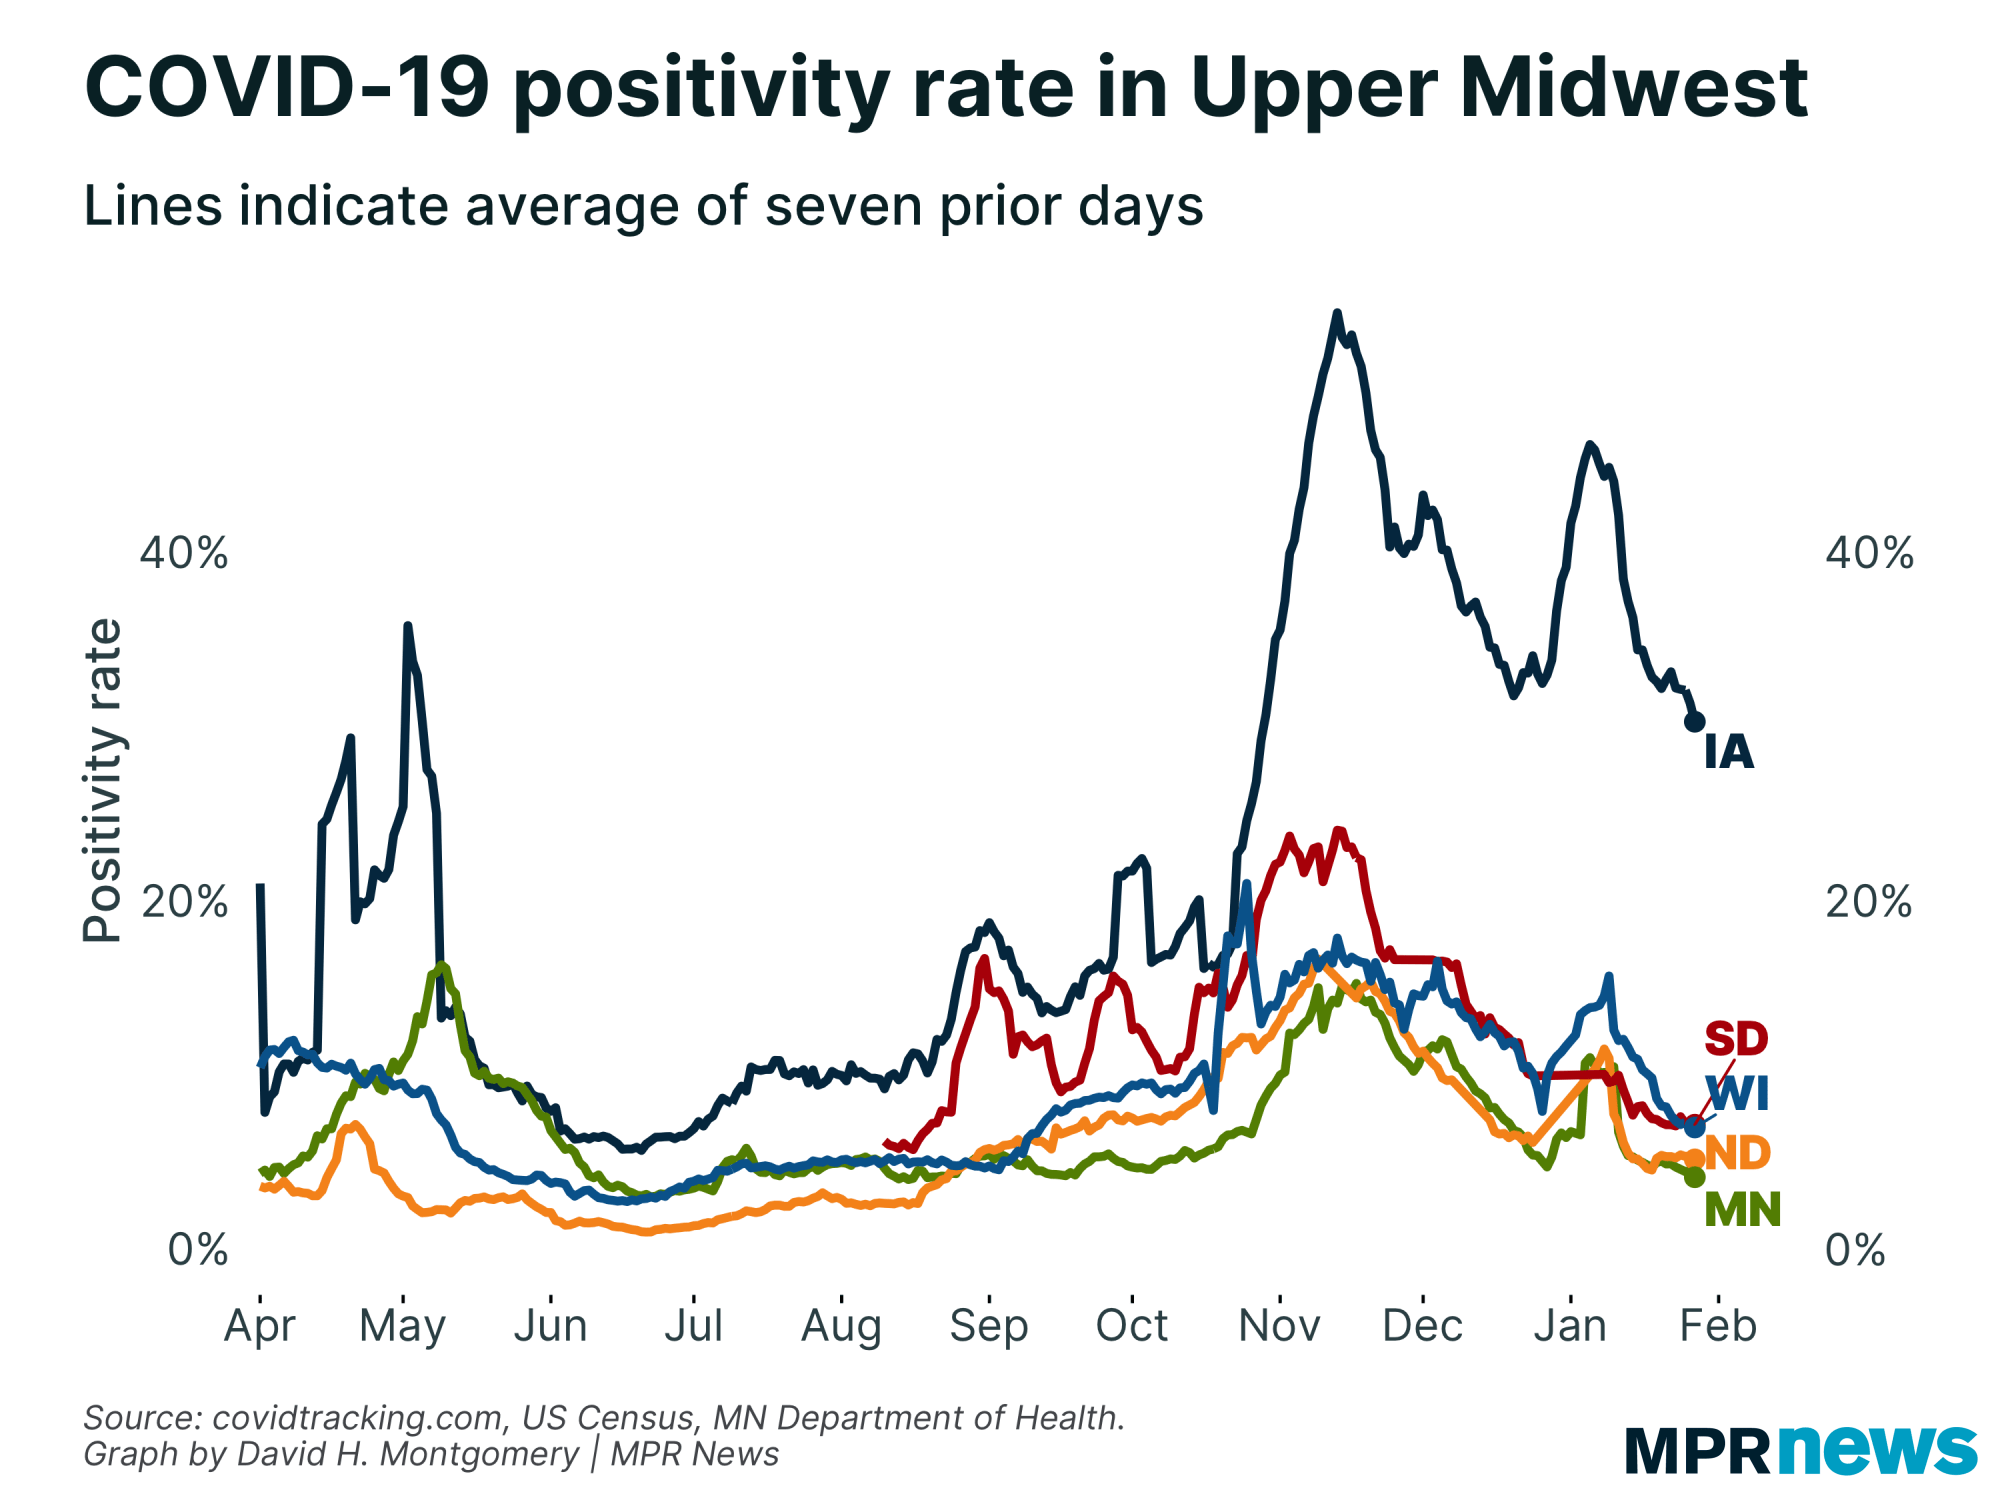
Another factor to consider is how many positive tests states are seeing compared to the number of tests they issue. If a state is rationing its limited supply of tests only to people with the highest probability of COVID-19 infection, they’ll get a higher share of positive results than a state that also tests lower-probability patients. A state with an expanding outbreak might also show a rising positive test rate.

The limited availability of tests means all these figures likely underestimate the number of COVID-19 cases — in part because mild cases of COVID-19 can share many symptoms with more familiar diseases such as the seasonal flu.
Hospitalization rates can be a way to look at the number of serious cases of COVID-19 — the ones with the potential to cause major health issues or even death.

As with other measures, larger states have more people and more hospital beds, so controlling for population can provide a better look at the true prevalence of these serious COVID-19 cases.

Some experts have suggested that death rates are a more reliable way to measure an often-fatal disease such as COVID-19, since they’re more likely to be noted than someone who gets sick with flu-like symptoms. Minnesota and Wisconsin have consistently reported the most new COVID-19 deaths in the region.

Raw death counts are skewed by population just like cases and tests. Adjusting for population, Minnesota and Wisconsin haven’t always had the most deaths in the region.

Editor’s note (July 1, 2020): This story has been updated to change graphs from showing cumulative COVID-19 stats to showing average of daily stats, with text updated to properly describe the updated graphs. The story and charts have also been corrected to say that the per capita data is per million residents, not per 100,000 residents.
Editor’s note (March 19, 2020): This story has been updated to reflect that Iowa stopped reporting total COVID-19 tests. Graphics have also been updated to remove “pending” COVID-19 tests from state’s totals.


