COVID-19: How it compares with other diseases in 5 charts

Go Deeper.
Create an account or log in to save stories.
Like this?
Thanks for liking this story! We have added it to a list of your favorite stories.
Updated: March 19, 2:32 p.m.
The fast-spreading novel coronavirus has caused thousands of deaths and disruptions to daily life across the world this year. On March 11, the World Health Organization classified COVID-19 as a global pandemic responsible for 4,000 deaths. The viral disease has spread into at least 114 countries.
Though the coronavirus is still being analyzed, here are five charts summarizing some of what we know about COVID-19 and how it compares to other diseases.
Coronavirus has spread steadily in recent months
New coronavirus cases have spread steadily since being discovered in the Chinese city of Wuhan in December 2019 and then more rapidly in the rest of the world.

Charts like this reflect only cases reported to the World Health Organization. People with no or minor symptoms, or who can’t get their symptoms tested for COVID-19, don’t appear on graphs like this. The number of people with coronavirus is higher than these figures show.
Turn Up Your Support
MPR News helps you turn down the noise and build shared understanding. Turn up your support for this public resource and keep trusted journalism accessible to all.
COVID-19 still smaller than the biggest pandemics
While the coronavirus has already infected more people than recent outbreaks like SARS in 2002-2003 or Ebola in 2013-2016, it hasn’t yet hit the scale of the largest modern pandemics — or even of the seasonal flu.

Unlike the other diseases, COVID-19 is still spreading worldwide. This chart could look very different in a month or two.
Coronavirus vs. seasonal flu
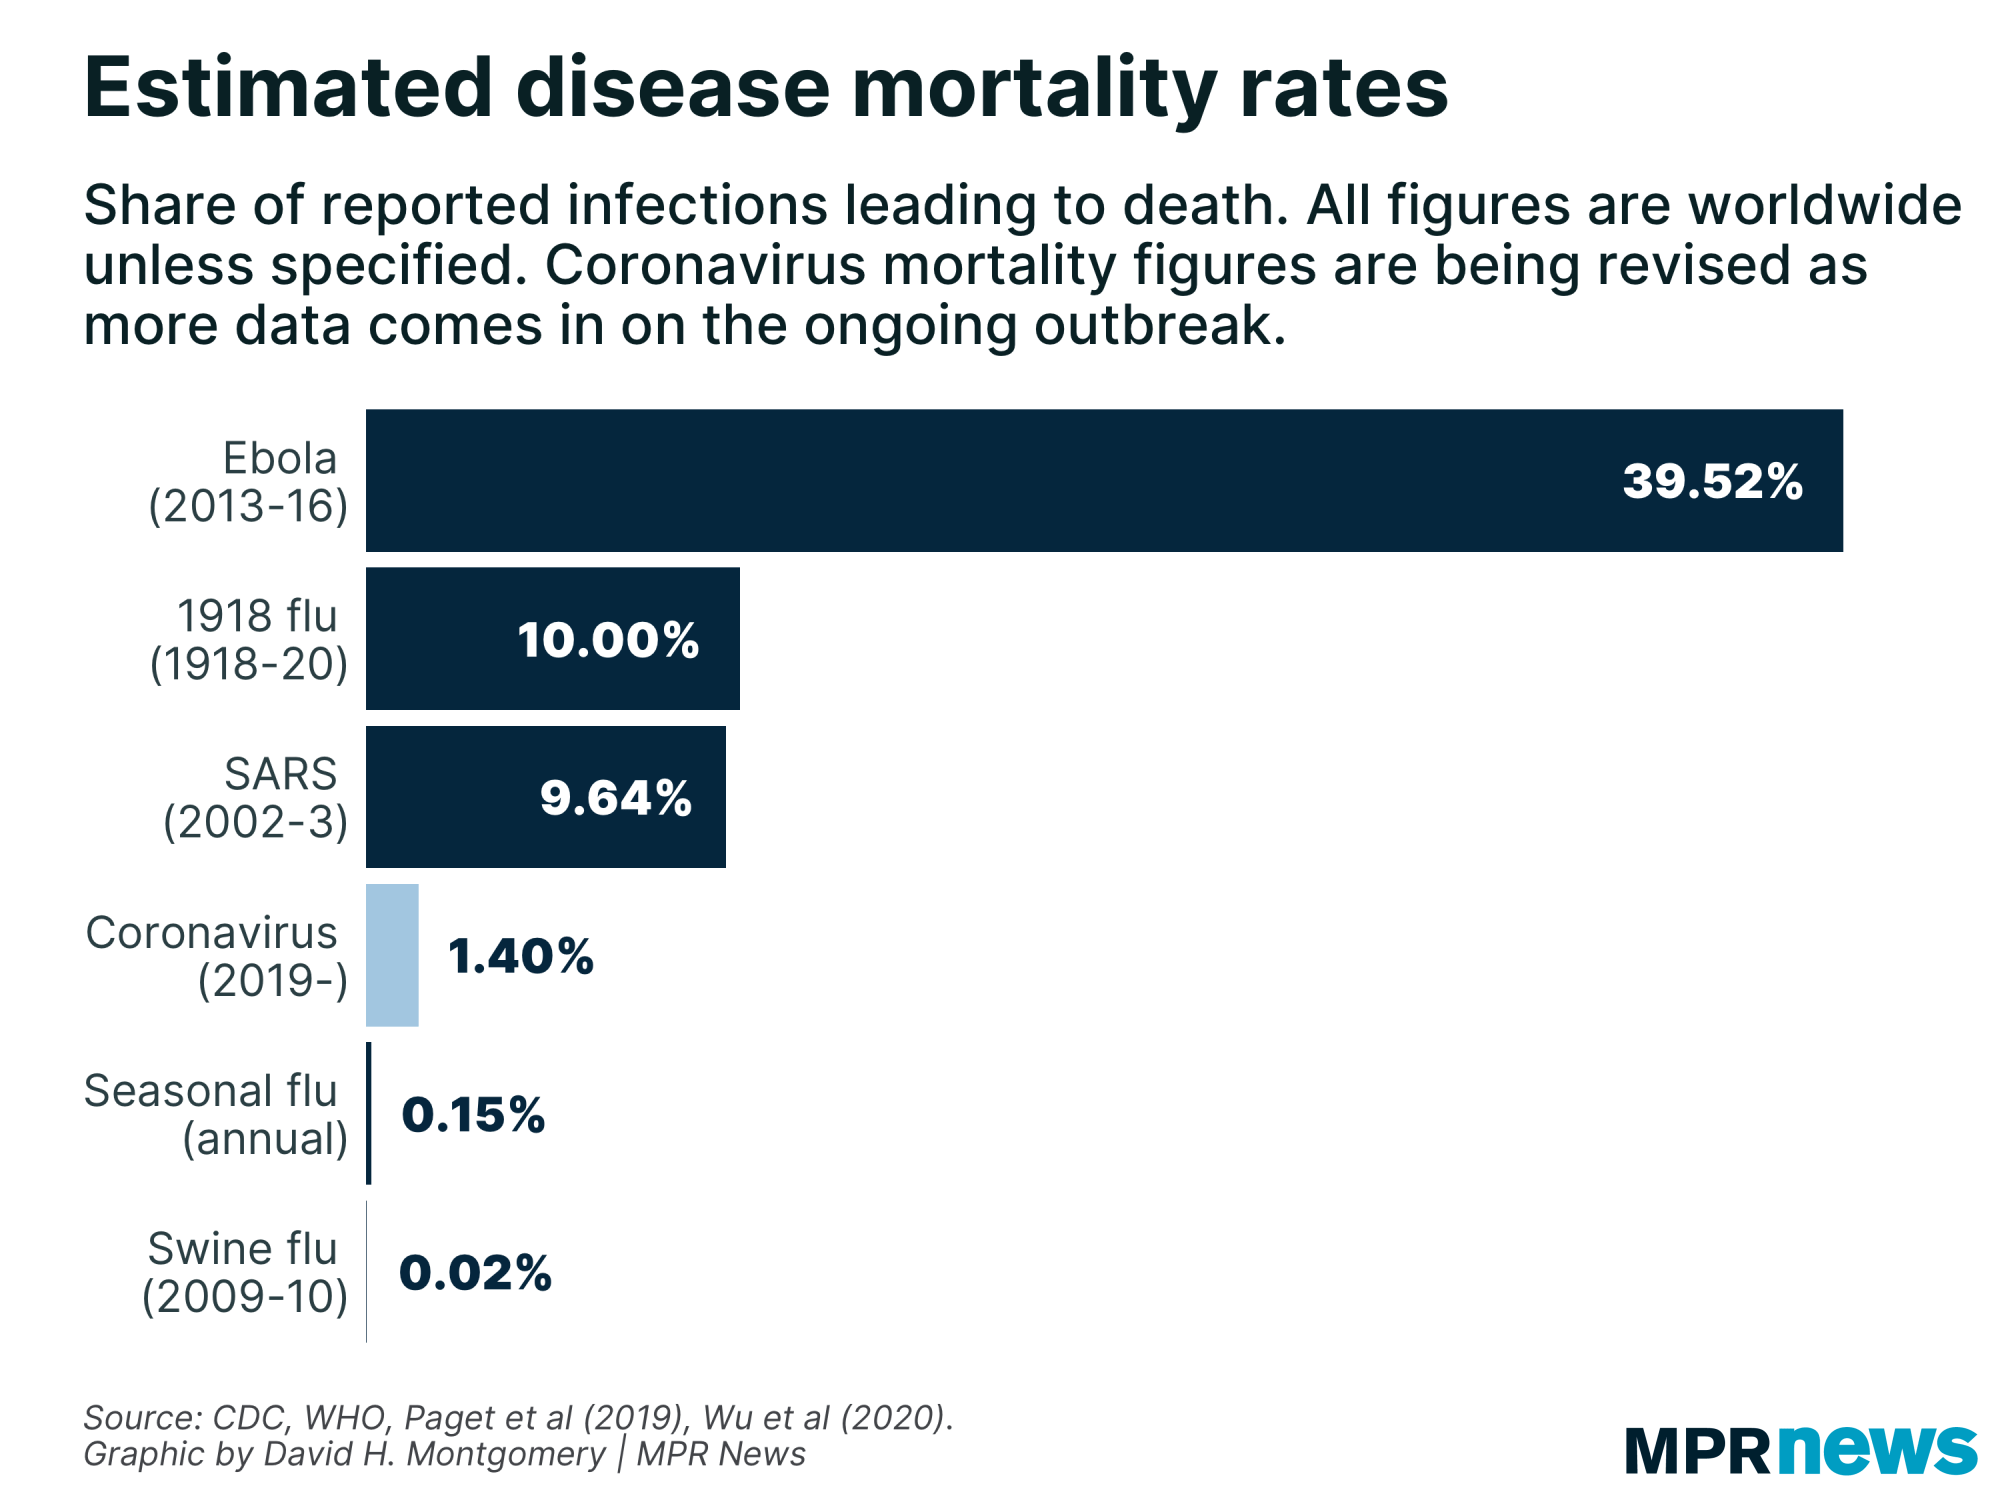
How many people a disease infects is only part of what makes it serious. The seasonal flu infects hundreds of millions of people each year, and is largely treated as a nuisance because it’s not life-threatening for most people who catch it. Ebola, in contrast, had less than 30,000 reported cases total over a multiyear outbreak, but it was treated as a crisis because of how deadly the disease can be if people do get sick.
Coronavirus is deadlier than the normal flu, but so far hasn’t reached the mortality rates seen in other recent outbreaks.

Scientists and doctors are still trying to pin down just how lethal COVID-19 is. That requires more study. COVID-19’s estimated 1.4 percent mortality rate so far will likely change as more and better information comes in.
Coronavirus hits the elderly the hardest
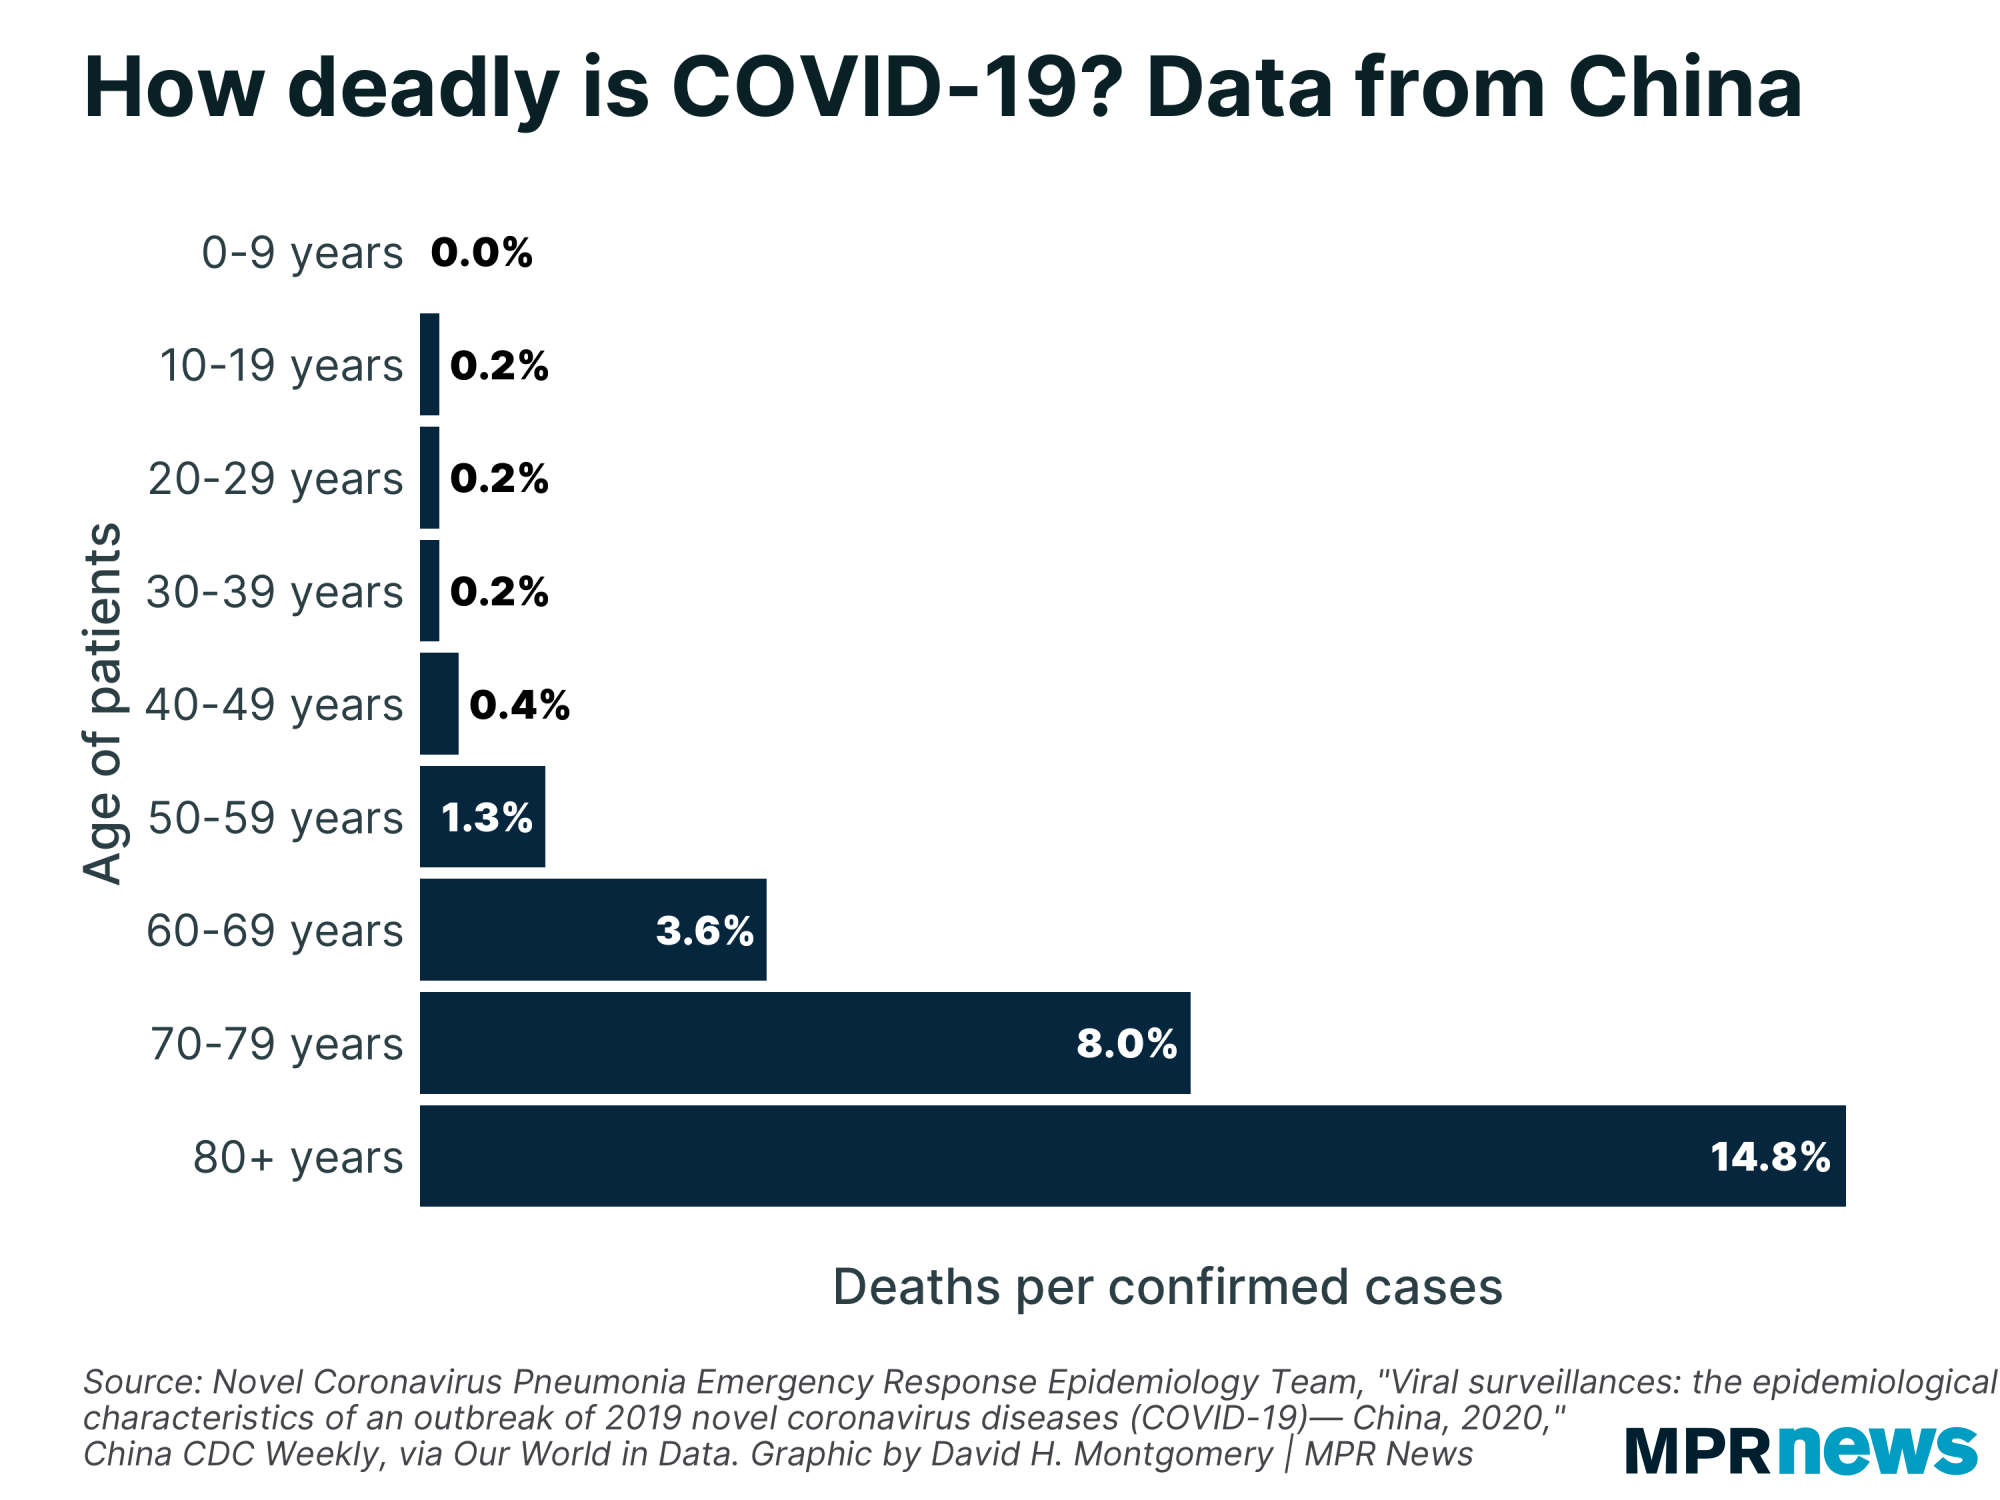
Though people of all ages have caught coronavirus, the disease has been deadliest among older patients with weaker immune systems. In data from China, less than two-tenths of one percent of victims under 40 who got COVID-19 died from their infection. But the mortality rate multiplied rapidly as patients got older, to nearly 15 percent among patients over 80.

One of the factors that made the 1918 flu pandemic so deadly was that even healthy people aged 20 to 40 died in high numbers from the disease. COVID-19 is dangerous but doesn’t share the 1918 pandemic’s lethality with young people.
Coronavirus is deadlier than the flu at every age
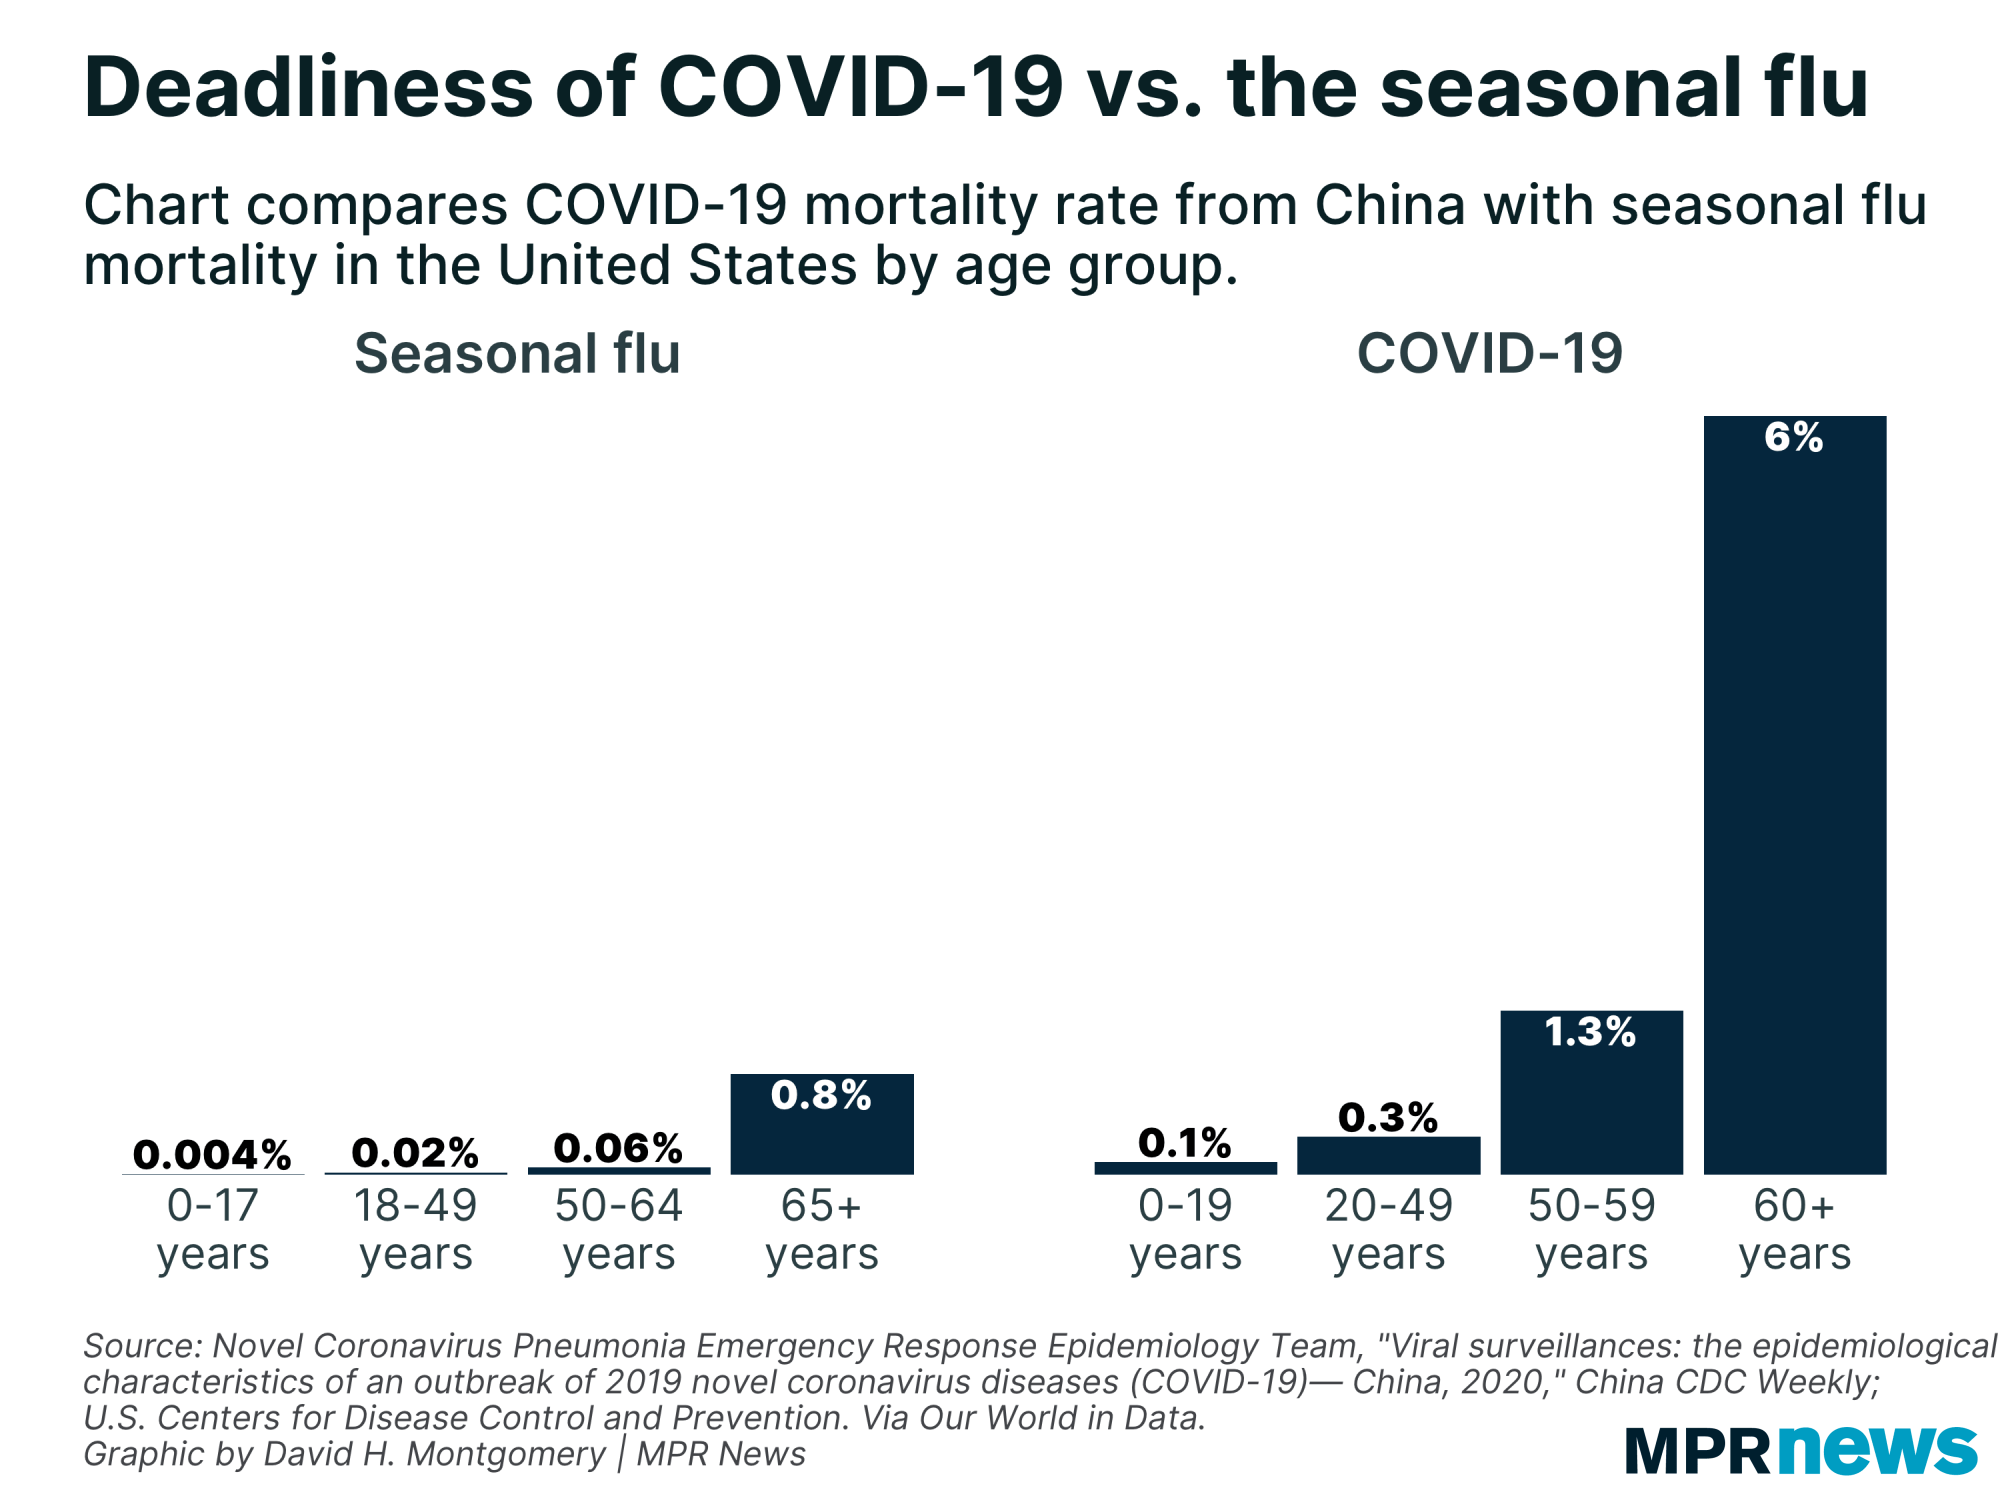
The seasonal flu, like coronavirus, gets deadlier as patients get older. But the two diseases are operating at completely different levels of mortality despite sharing a pattern, and data so far suggests COVID-19 is many times deadlier than the seasonal flu at every age group.

For example, in Chinese data, just one-tenth of one percent of coronavirus patients younger than 20 died from the disease. But that’s still 25 times higher than the seasonal flu’s 0.004 percent mortality rate among patients 17 or younger.
Similarly, coronavirus appears 15 times deadlier than the flu among adults under 50, and 7.5 times deadlier among seniors. (Age brackets for which data is available differ slightly for the two diseases.)
Update (March 19, 2020): The chart tracking worldwide cases of COVID-19 over time has been updated to use data from the European Center for Disease Control and Prevention instead of the World Health Organization, after WHO changed its methodology on March 18 in a way that makes comparisons before and after that date difficult.
Correction (March 17, 2020): Previous versions of this story relied on incorrect statistics that understated the number of estimated cases of the 2009-10 swine flu outbreak, and overstated that outbreak’s fatality rate. Graphics have also been updated to reflect newer estimates as to the morality rate of COVID-19.
Correction (March 12, 2020): A previous version of a chart in this article misstated the number of Americans each year who catch the seasonal flu. The correct estimate is up to 49 million, according to the Centers for Disease Control and Prevention.


