

Big data drives Minnesota's COVID-19 response. Take a look under the hood.

Go Deeper.
Create an account or log in to save stories.
Like this?
Thanks for liking this story! We have added it to a list of your favorite stories.
Updated: April 17, 2020 at 8:55 a.m. | Posted: April 16, 2020 at 7:30 p.m.
Gov. Tim Walz and other state leaders are basing their response to COVID-19 in part on a computer model constructed through a collaboration between the Minnesota Department of Health and the University of Minnesota School of Public Health. It’s one of a number of computer models developed by health agencies and academics around the world to predict the course of the pandemic.
The models predict the demand for ICU beds and the number of people who might die from the disease. With so much unknown about COVID-19, they use estimates about how quickly it might spread and how deadly it is to make their predictions.
Walz and other state leaders then weigh these predictions against other factors, such as the social and economic impacts of a shelter-in-place order, to determine which responses to require or advise.
Minnesota’s COVID-19 model doesn’t make a single prediction about the impact of the disease. It makes thousands of predictions: One for each combination of variables — from how long individuals are infectious to how long a typical hospital stay lasts — replicated over a host of different scenarios based on how long the state maintains its stay-at-home policy and social distancing practices.
Turn Up Your Support
MPR News helps you turn down the noise and build shared understanding. Turn up your support for this public resource and keep trusted journalism accessible to all.
For each of those scenarios with their combined thousands of simulations and variables, researchers have identified a “baseline” — a simulation based on inputs they think are particularly plausible, given the available data.
Researchers shared data from 100 of their thousands of simulations with MPR News Thursday — a randomly chosen 50 simulations from two specific scenarios. Those simulations were run on April 8, the day Walz extended Minnesota’s stay-at-home order through early May, and are being regularly updated with new information.
Visualizing the simulations
This chart shows a sample of 50 of those simulations, for a scenario in which three things happen: Minnesota ends its stay-at-home order in early May; shifts to generalized social distancing for the remainder of May; and encourages vulnerable adults to stay home for much of the rest of the year. The researchers behind the model have dubbed this “Scenario 4A.”
All of the simulations under those conditions show daily deaths from the disease peaking in the summer or early fall, but with considerable differences in that peak’s timing and severity.

To understand the range of impacts these simulations predict, consider these three: The dark line in the graphic below shows the baseline simulation, based on inputs the researchers consider to be particularly plausible. The green and blue lines show two extreme, less likely simulations, with input variables on the outer edges of what the researchers consider plausible.
Under one of the extreme simulations — represented by the blue line — COVID-19 hits Minnesota hard, with thousands of people dying just after the Fourth of July.
In the other extreme simulation — represented by the green line — Minnesota avoids any serious outbreaks into September, when it suffers a relatively mild peak.
The two simulations are created by different inputs to the equation — different assumptions about how the disease might behave.
In the first scenario, represented by the blue line, COVID-19 is considered to be more infectious, with a significantly higher probability of transmission than in the latter. It hits sick people much harder, requiring more than 16 days in intensive care for the average ICU patient, compared to just under 11 days in the latter simulation that’s represented by the green line.
Because of these differences, the first scenario involves far more infections, and patients take up ICU beds for longer. That reduces the supply of intensive care beds available for other patients who need them — a recipe for catastrophic results.
The baseline simulation, considered more likely than the extreme scenarios, is in between: It suggests a late July peak with around 500 fewer daily deaths at the peak than the most extreme simulation.

These three scenarios highlight how what we don’t know about COVID-19 makes the disease hard to predict. Epidemiologists have guesses for how contagious the disease is, and how deadly it will be, but don’t know for certain because it’s so new. That means even the best attempts to predict how it will impact Minnesota involve considerable uncertainty.
Comparing the scenarios
The model’s predictions don’t just depend on unknowns about the disease. They also take into account questions about how humans will respond to COVID-19 through staying at home, social distancing, or continuing business as usual.
In addition to scenario 4A, researchers have also simulated a number of other scenarios, from one in which Minnesota takes no action in response to COVID-19 to one with a short stay-at-home order but longer forms of mild social distancing.
The simulations predict deaths as well as the demand for ICU beds, a critical component of the response. Someone with a severe case of COVID-19 who needs an ICU bed but isn’t able to get one is much more likely to die from the disease — 100 times more likely, in the model’s parameters.
The data researchers provided to MPR News this week took into account two scenarios: Scenario 4A, and Scenario 2, in which Minnesota ends its stay-at-home order on April 10. Both were developed before Walz extended the state’s stay-at-home order to May 4.
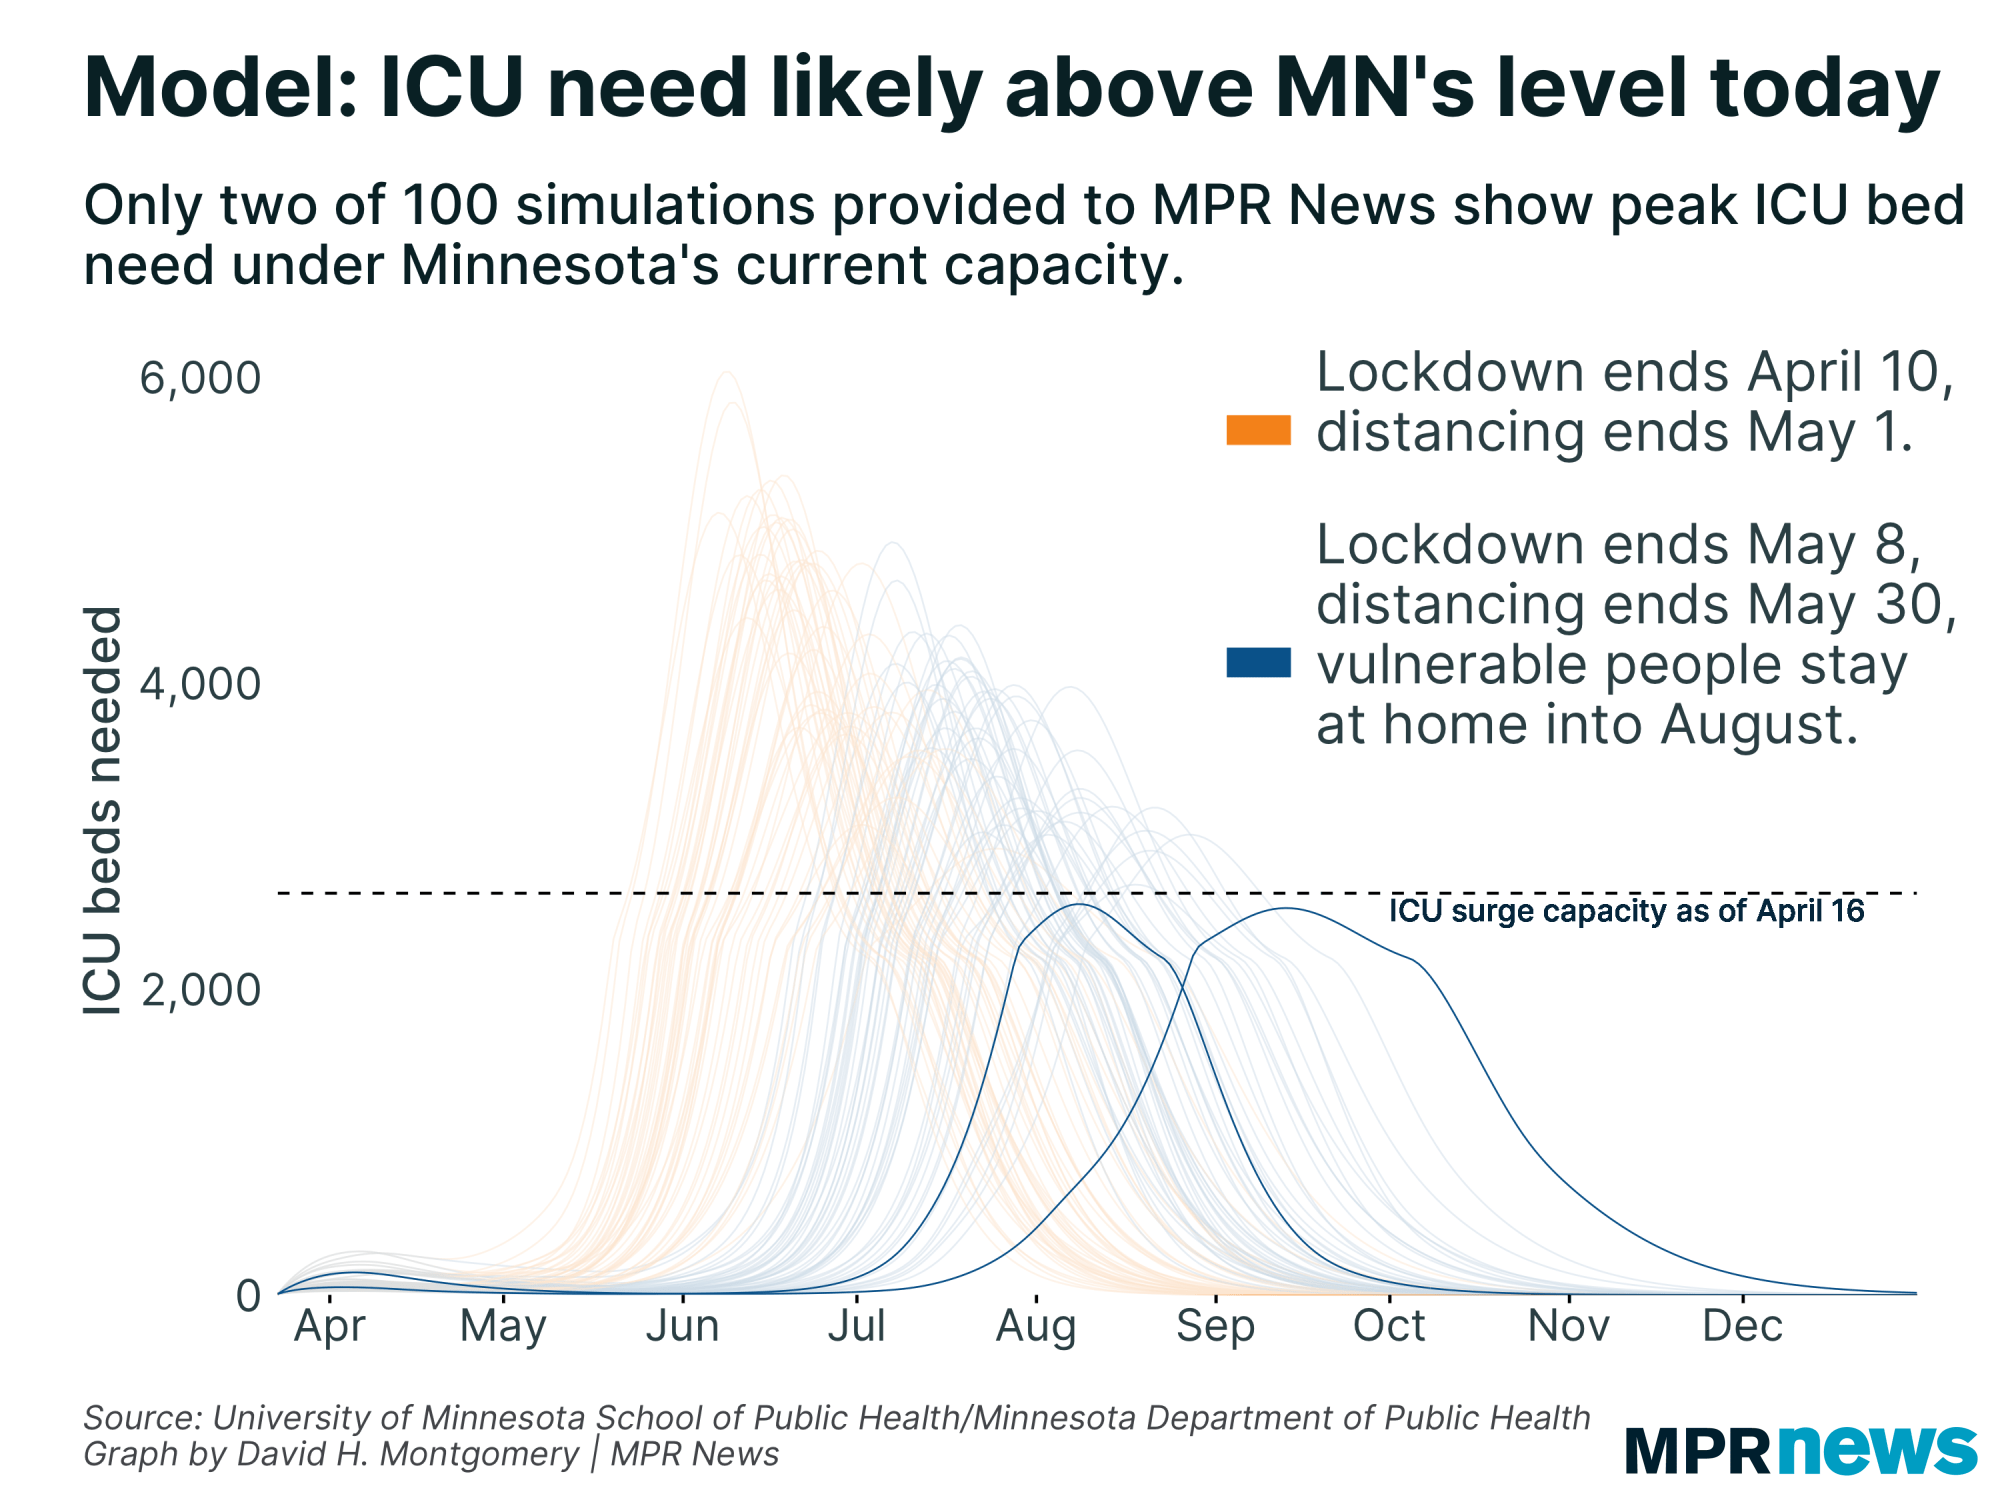
Both scenarios were run across 1,000 different simulations, of which 50 each are shown below, outlining daily demand for intensive care beds.
The Scenario 2 simulations, in orange, show the disease hitting Minnesota faster and harder than the simulations with a longer stay-at-home order and social distancing. The baseline simulation — which researchers consider most likely under the scenarios — is highlighted in each.

Minnesota has been expanding its ICU capacity in its efforts to be able to handle the disease at its peak. As of April 16, officials estimated the state could have 2,625 ICU beds within 72 hours — a combination of the beds it has now, and beds it would be able to make available in a few days to respond to demand.
Almost all of the simulations the model produced show Minnesota’s outbreak requiring more than those 2,625 ICU beds. Only two simulations of the 100 provided to MPR News stay under that threshold.
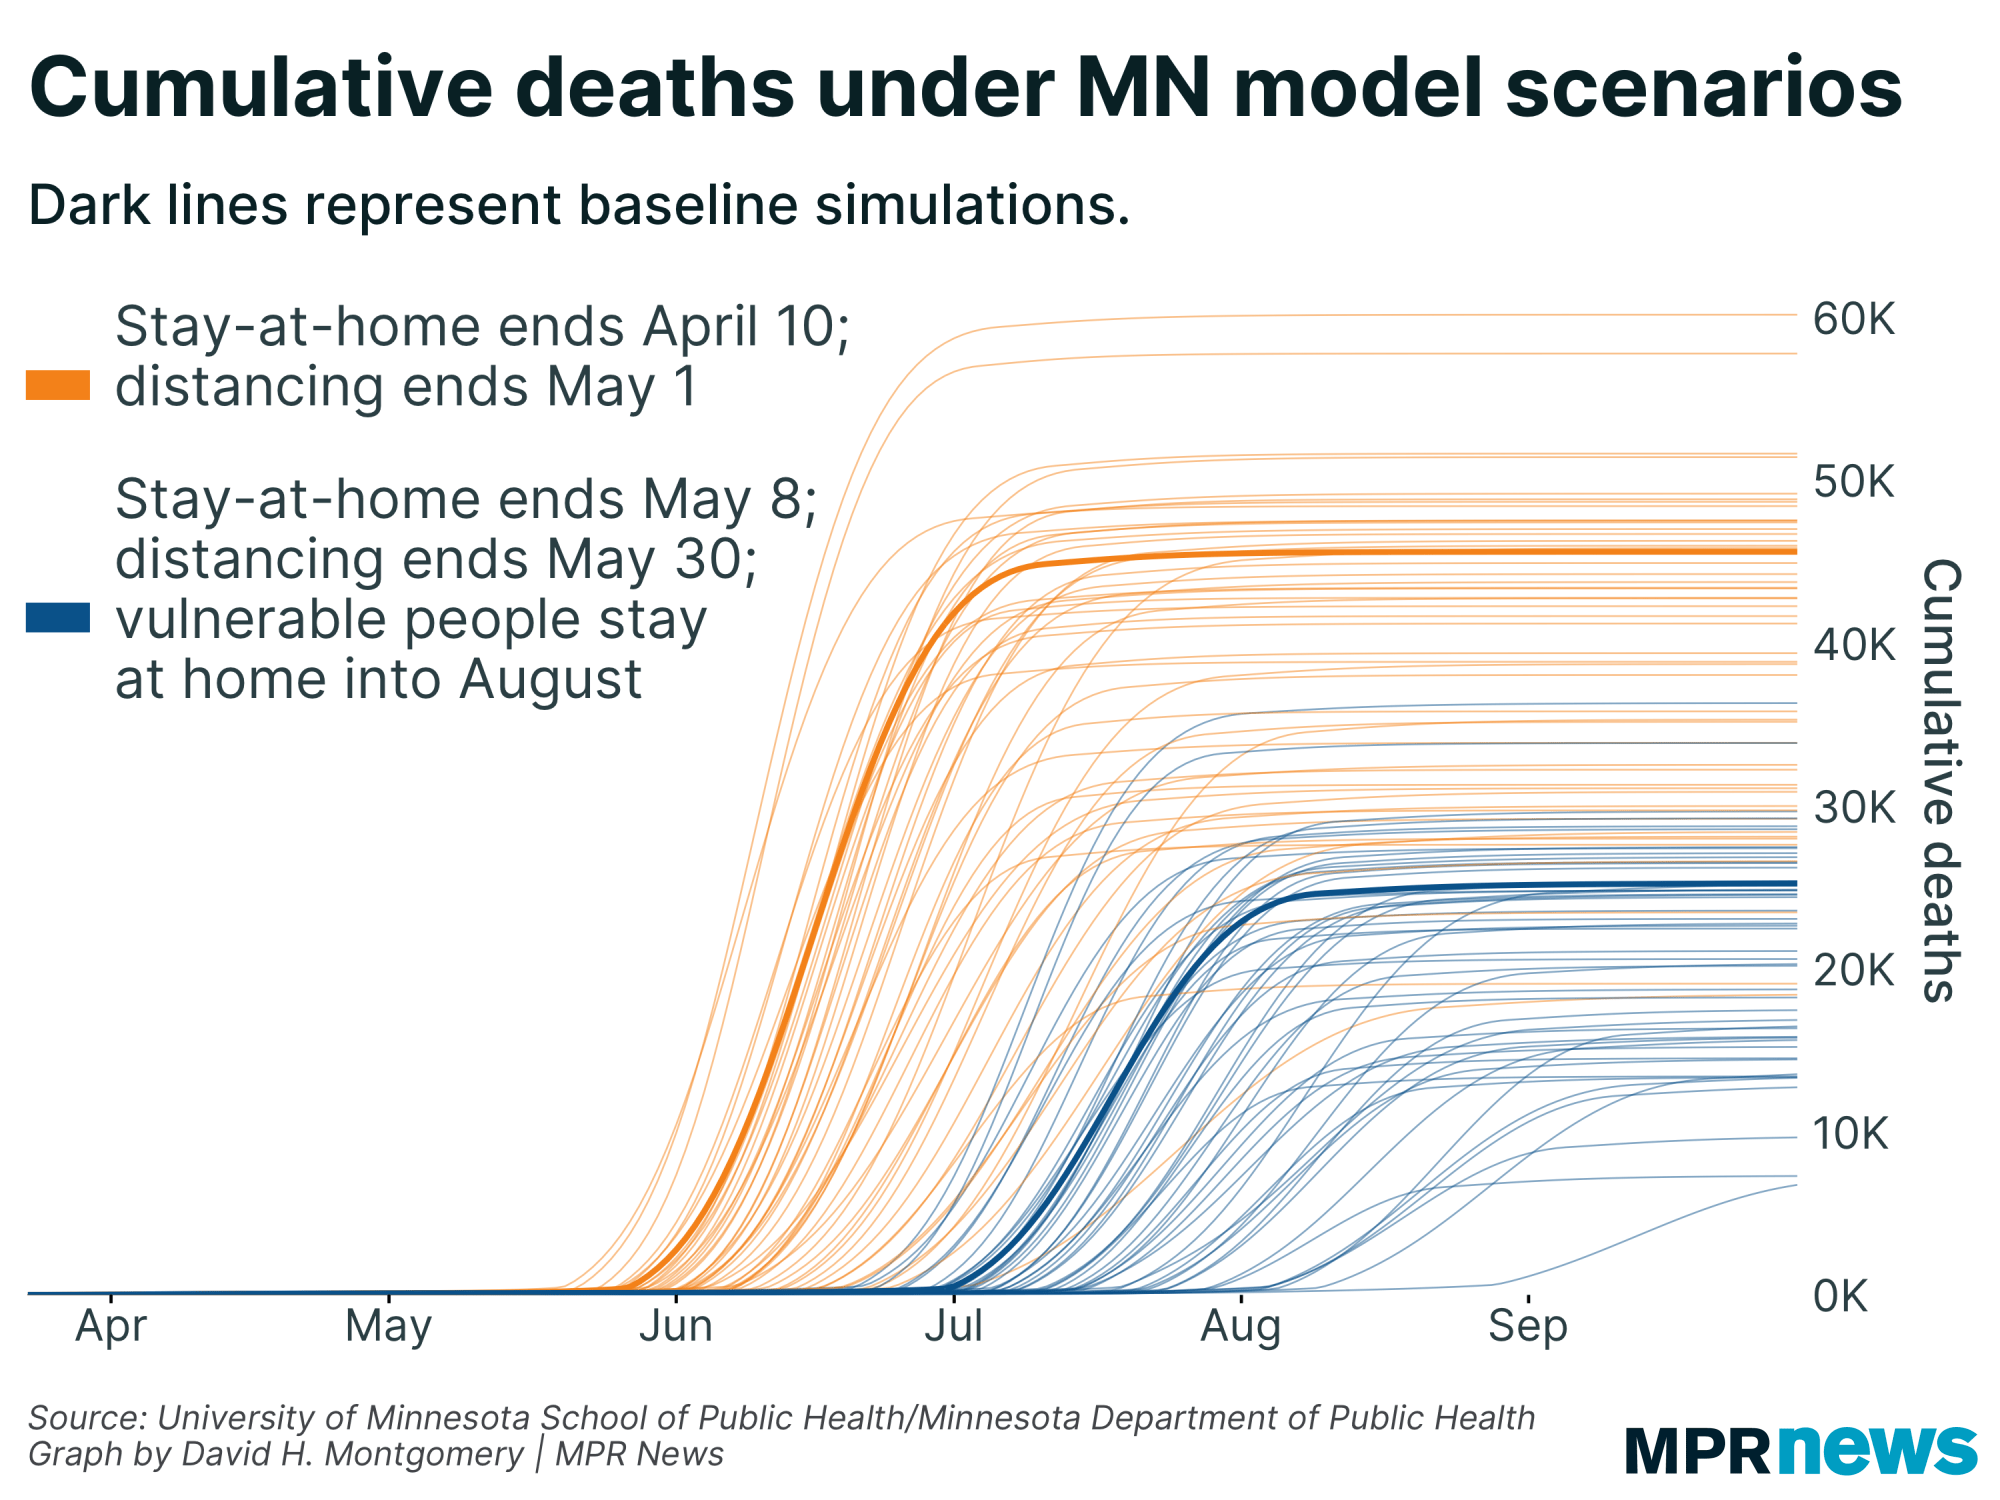
The University of Minnesota/Health Department simulations stand out among their counterparts for one major reason: They predict that a lot of people will die from the disease, even in the best-case scenario.
The baseline simulation for Scenario 4A, with a stay-at-home order into May and social distancing through the end of that month, still predicts that 25,000 people will die in Minnesota by the time the outbreak is over.
That’s a much higher mortality rate than most other models are predicting. For example: Dr. Anthony Fauci, a member of the White House’s COVID-19 task force, predicted last week that the total death toll for the entire country would be “more like 60,000” than his earlier prediction of “100,000 to 200,000.”
But if 25,000 people were to die of COVID-19 in Minnesota and the state’s deaths were proportional to its share of the U.S. population, the country would be looking at 1.45 million COVID-19 deaths — an order of magnitude above Fauci’s latest prediction.
Similarly, the models released April 13 by the Institute for Health Metrics and Evaluation at the University of Washington predict 656 COVID-19 deaths in Minnesota through Aug. 4 — a shorter time frame than Minnesota’s model takes into account, but still more than an order of magnitude below it. Whereas the Minnesota model predicts a summer peak, the current IHME model has Minnesota’s cases peaking in late April or early May.
One model that predicted potential COVID-19 mortality along the same lines as Minnesota’s was the model produced by the COVID-19 team at the Imperial College of London, which predicted about 1.2 million deaths in the U.S. under “the most effective mitigation strategy examined,” and 2.2 million deaths if no measures were taken.
Every model of the disease makes different assumptions and uses different methodologies — and all are trying to simplify and predict a complex and evolving situation, with a host of unknowns. Minnesota’s researchers said they believe their model is the best fit for the state.
“We feel good about the model and the structure. It aligns well with the disease as we understand it right now,” said Stefan Gildemeister, the state’s health economist, who said that he feels the University of Washington model in particular includes “some incredibly optimistic assumptions.”
The researchers are regularly updating their simulations as new information becomes available.
An earlier version of the model, produced in March, for instance, was based primarily on data from China. The new version incorporates early data from Minnesota and western Europe.
Future versions of the model will include additional data and may change accordingly.
The researchers said they are planning to release the code of their model sometime later in April.
COVID-19 in Minnesota
Health officials for weeks have been increasingly raising the alarm over the spread of the novel coronavirus in the United States. The disease is transmitted through respiratory droplets, coughs and sneezes, similar to the way the flu can spread.
Government and medical leaders are urging people to wash their hands frequently and well, refrain from touching their faces, cover their coughs, disinfect surfaces and avoid large crowds, all in an effort to curb the virus’ rapid spread.
The state of Minnesota has temporarily closed schools, while administrators work to determine next steps, and is requiring a temporary closure of all in-person dining at restaurants, bars and coffee shops, as well as theaters, gyms, yoga studios and other spaces in which people congregate in close proximity.