Latest on COVID in MN: Wastewater data, falling case counts signal pandemic's ebb

Go Deeper.
Create an account or log in to save stories.
Like this?
Thanks for liking this story! We have added it to a list of your favorite stories.
3 things to know:
1,260 hospitalized; 194 in ICU, one of the lowest points since September
New cases counts trending at lowest in three weeks
Data suggest Minnesota’s COVID-19 outbreak probably peaked several weeks ago, especially in the Twin Cities
Key metrics tracking the spread of COVID-19 in Minnesota continue to brighten. That includes numbers on COVID in Twin Cities wastewater, hospital and intensive care needs and the rate of tests coming back positive for the disease.
Collectively, the newest numbers paint a hopeful picture of a pandemic that — finally — may be in retreat following a surge that exploded after the year-end holiday season, driven by COVID’s omicron mutation.
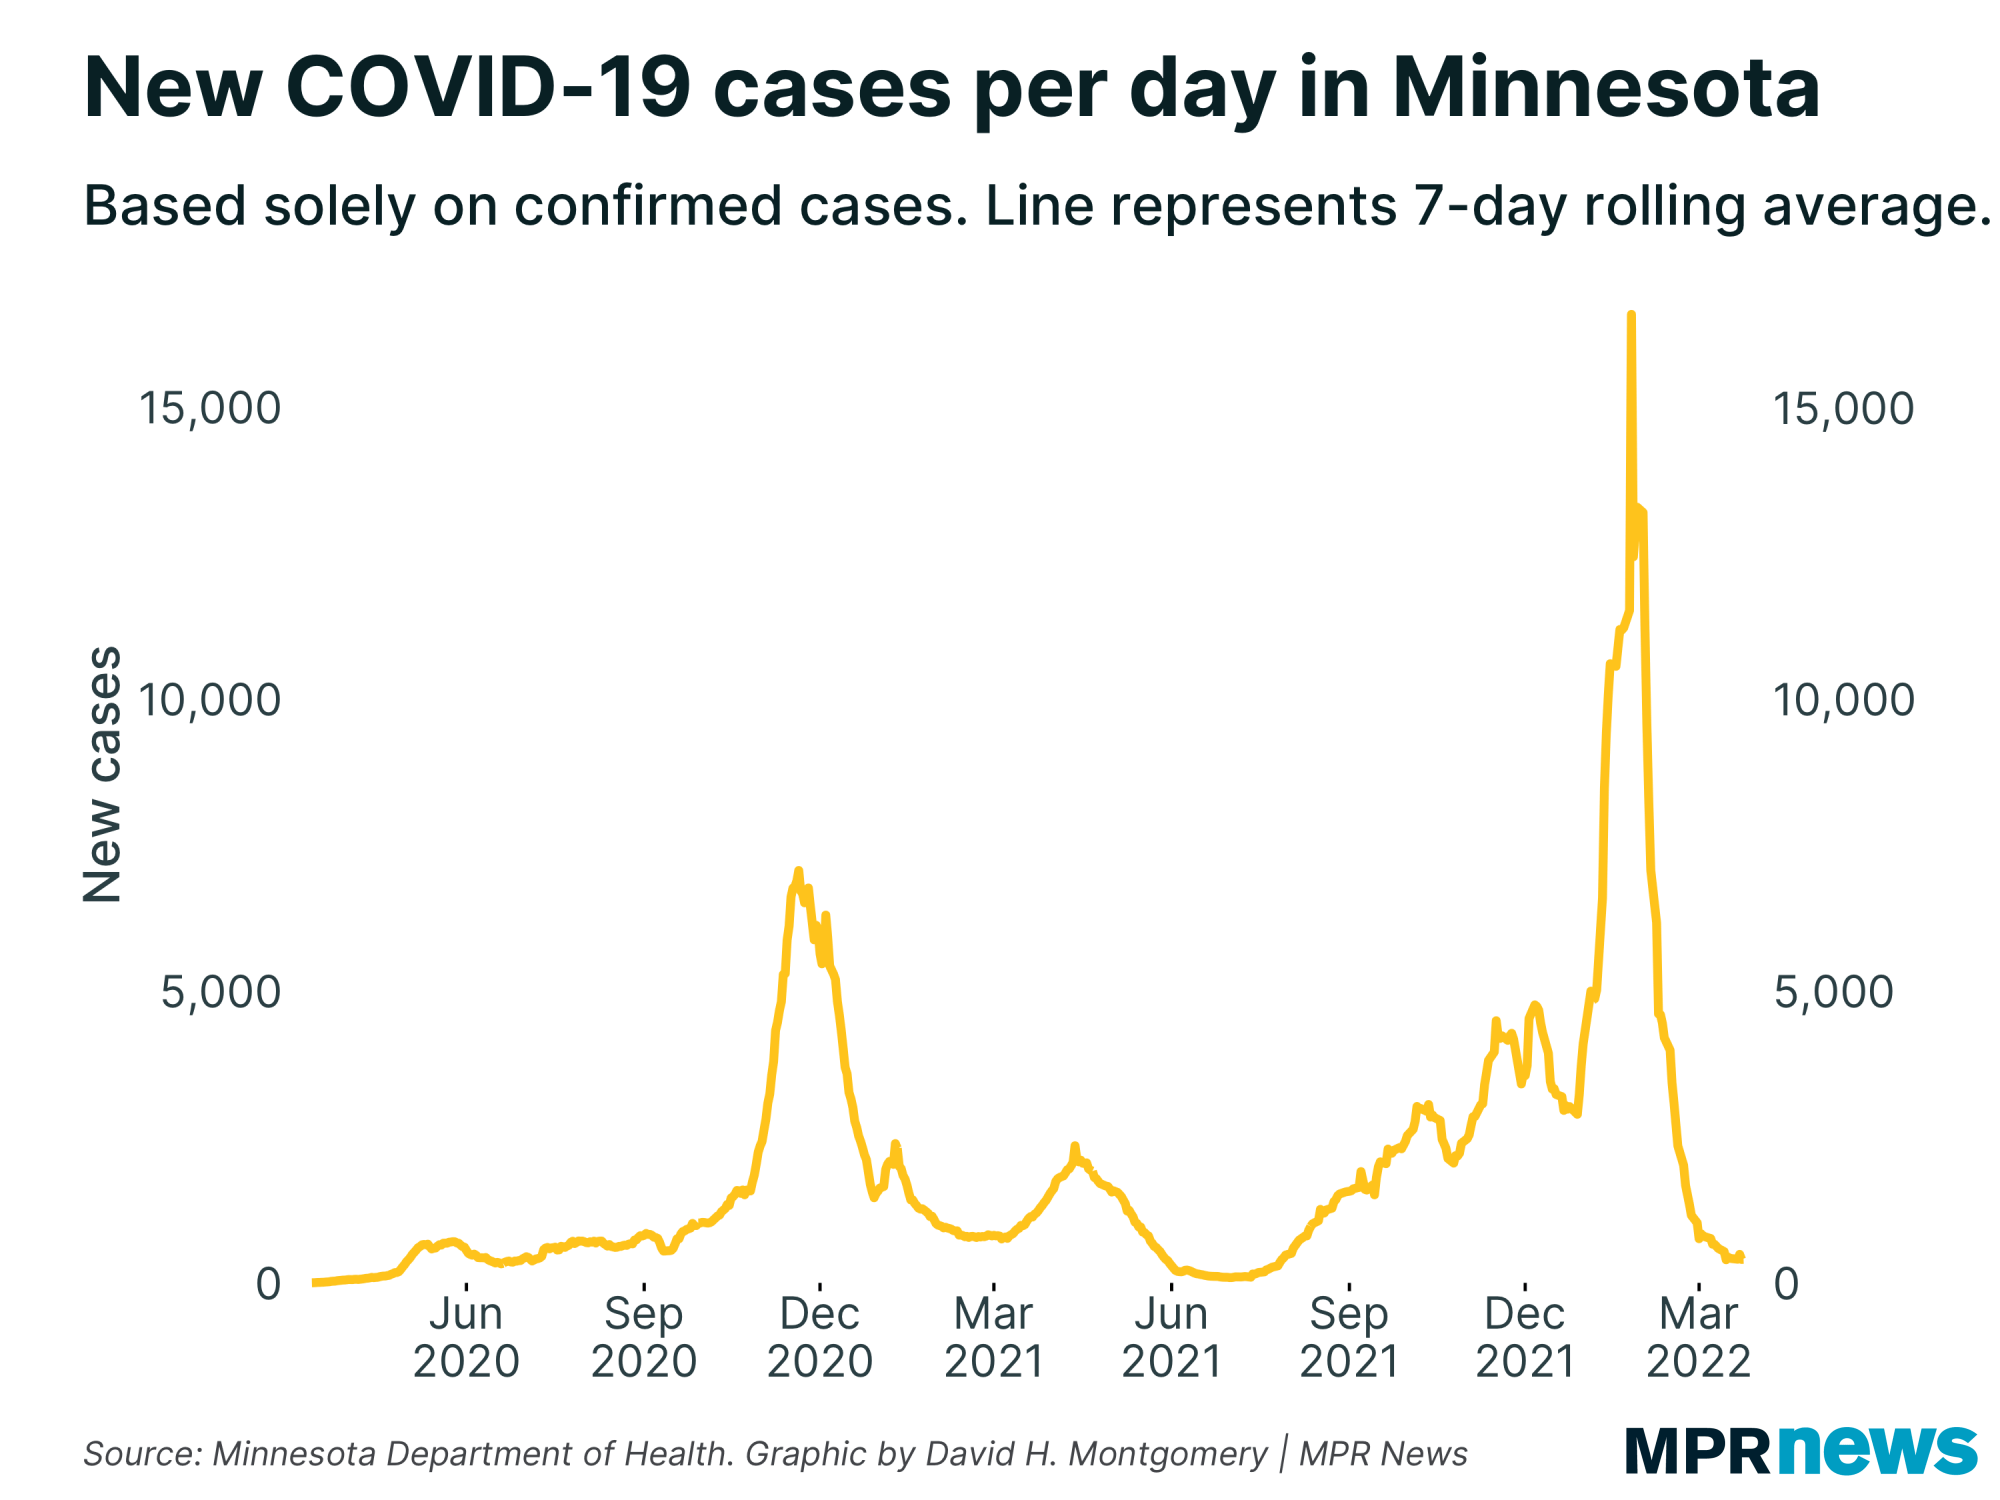
Data from the Minnesota Department of Health shows new cases and positivity rate peaked statewide around Jan. 10. That likely represents when COVID-19 peaked in the Twin Cities metro area, which got hit by omicron before the rest of the state.
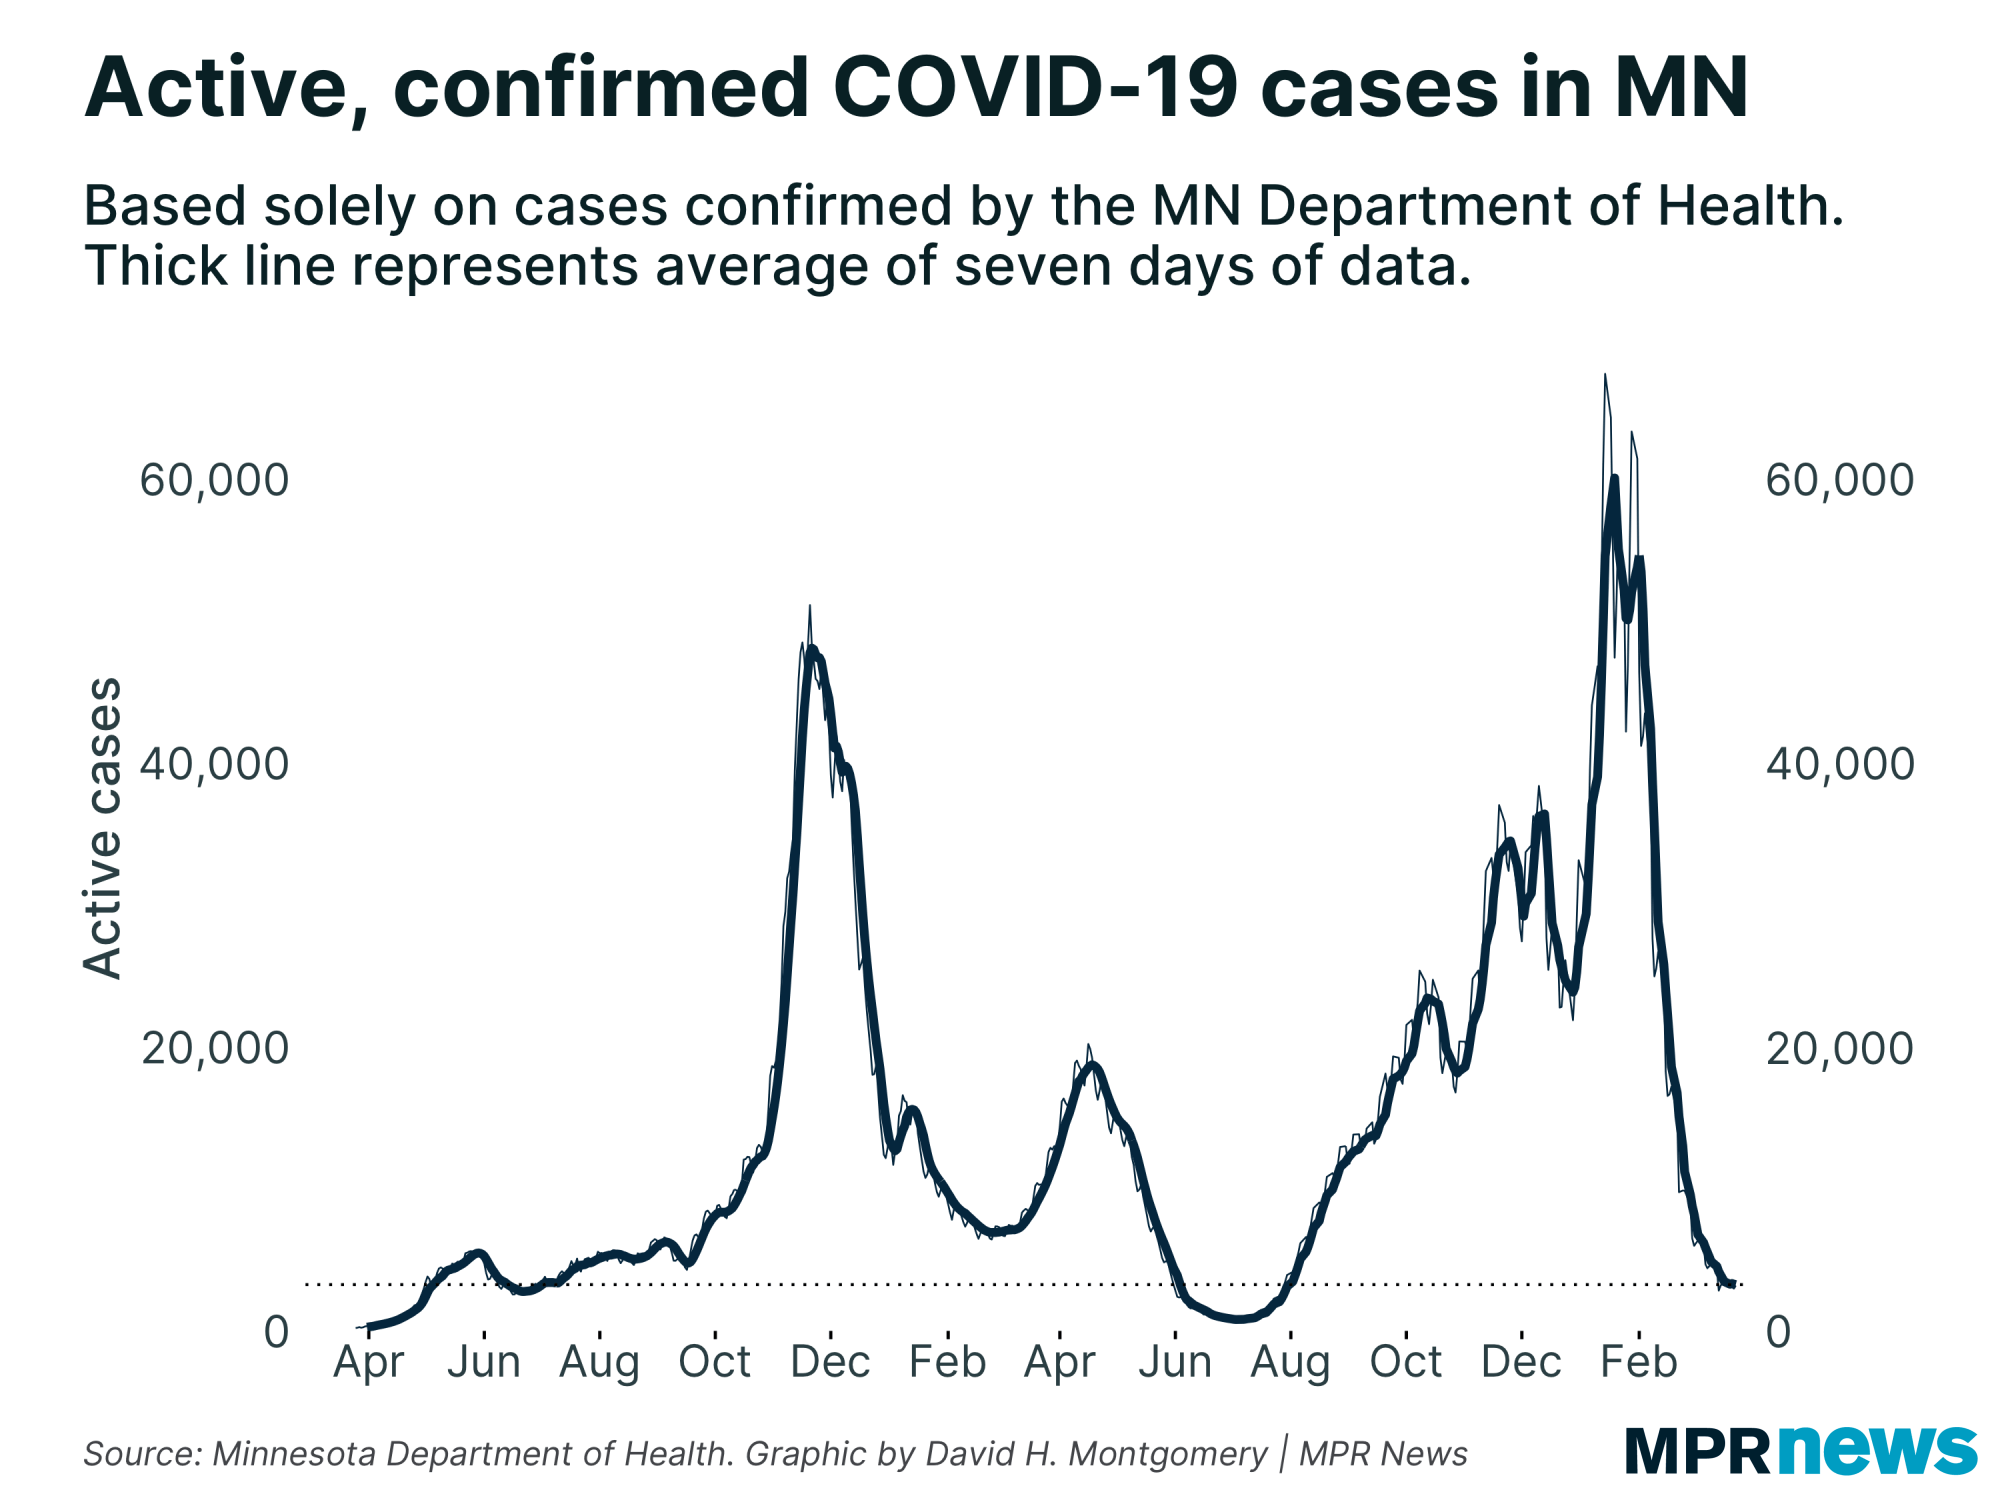
Overall, there are around 43,000 active, confirmed COVID-19 cases in Minnesota. That’s down dramatically from mid-January, when active cases topped 67,000.
Support Local News
When breaking news happens, MPR News provides the context you need. Help us meet the significant demands of these newsgathering efforts.
Hospitalizations are still high — 1,260 — but trending down. Intensive care demands are at one of their lowest points since September, with 194 COVID patients currently occupying ICU beds.
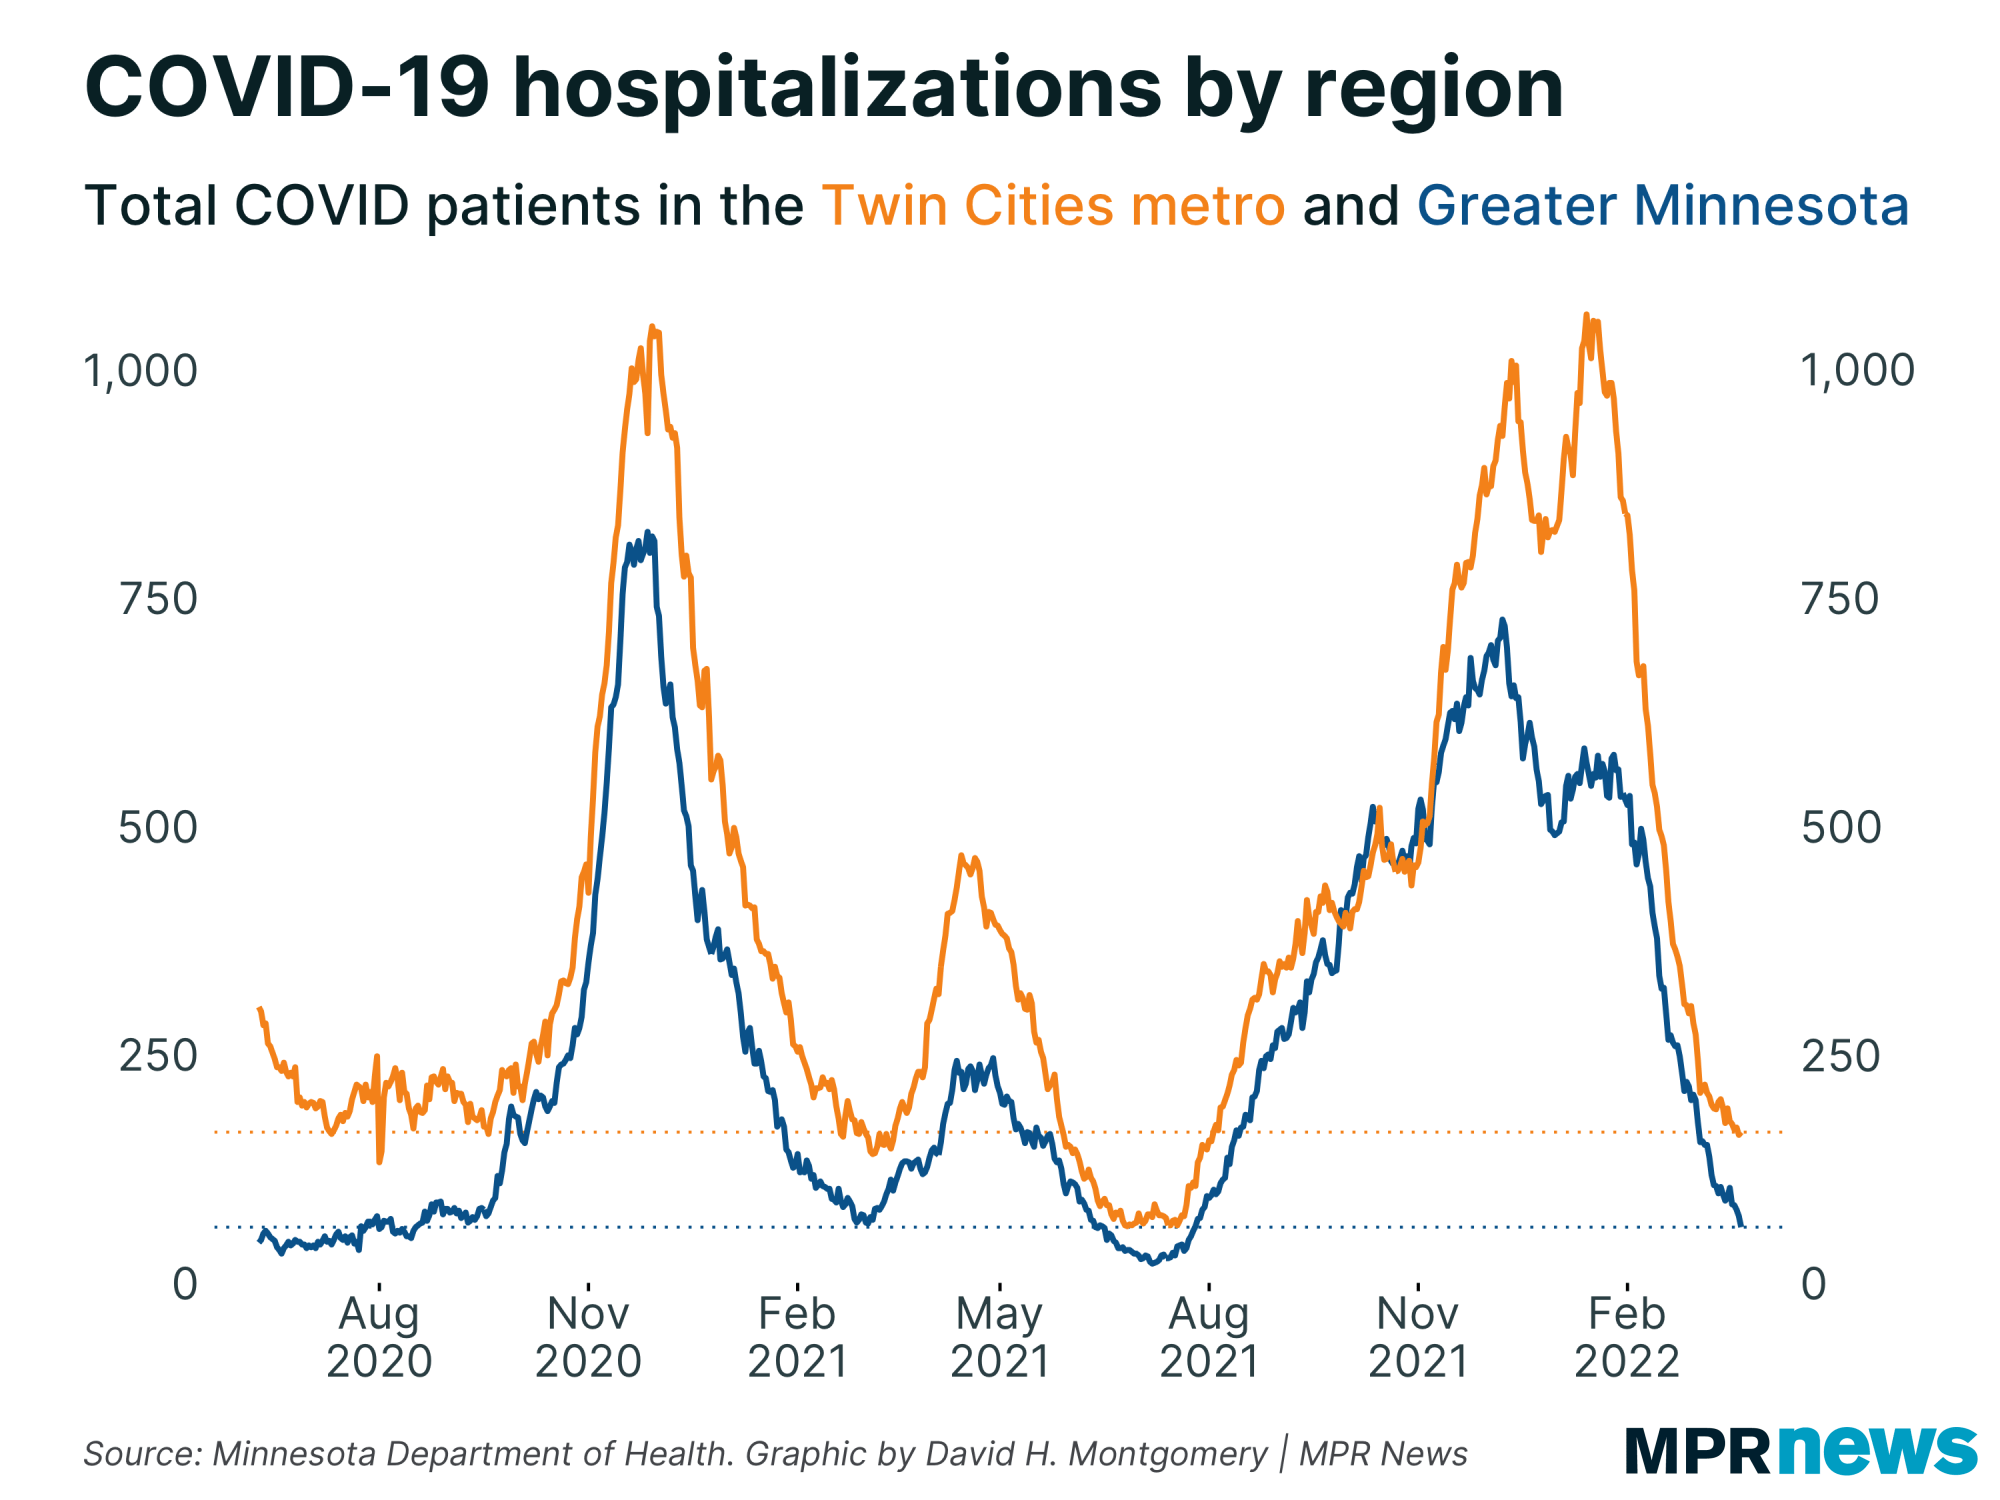
Hospital bed capacity remains very tight, but it’s moving in the right direction. About 4.8 percent of Minnesota ICU beds are currently available, which is low but still the most since early October.
Wastewater data released Friday by the Metropolitan Council showed COVID-19 rates in the Twin Cities region back to where they were in early November and still falling, as of Jan. 31.
Vigilance is still needed as the numbers are still relatively high. In July, Minnesota appeared to be through the worst of the pandemic, and then the omicron variant hit hard.
The most recent map from the federal Centers for Disease Control and Prevention shows all Minnesota counties with a high rate of viral transmission.
The current wave, though, appears to be past its peak, Mayo Clinic data scientist Curtis Storlie told MPR News earlier this week. There will continue to be thousands more positive test results and hospitalizations, he added, so people should still take precautions.

Minnesota’s positive test rate has been moving steadily downward, with sample data showing positivity trending at levels not seen since November.

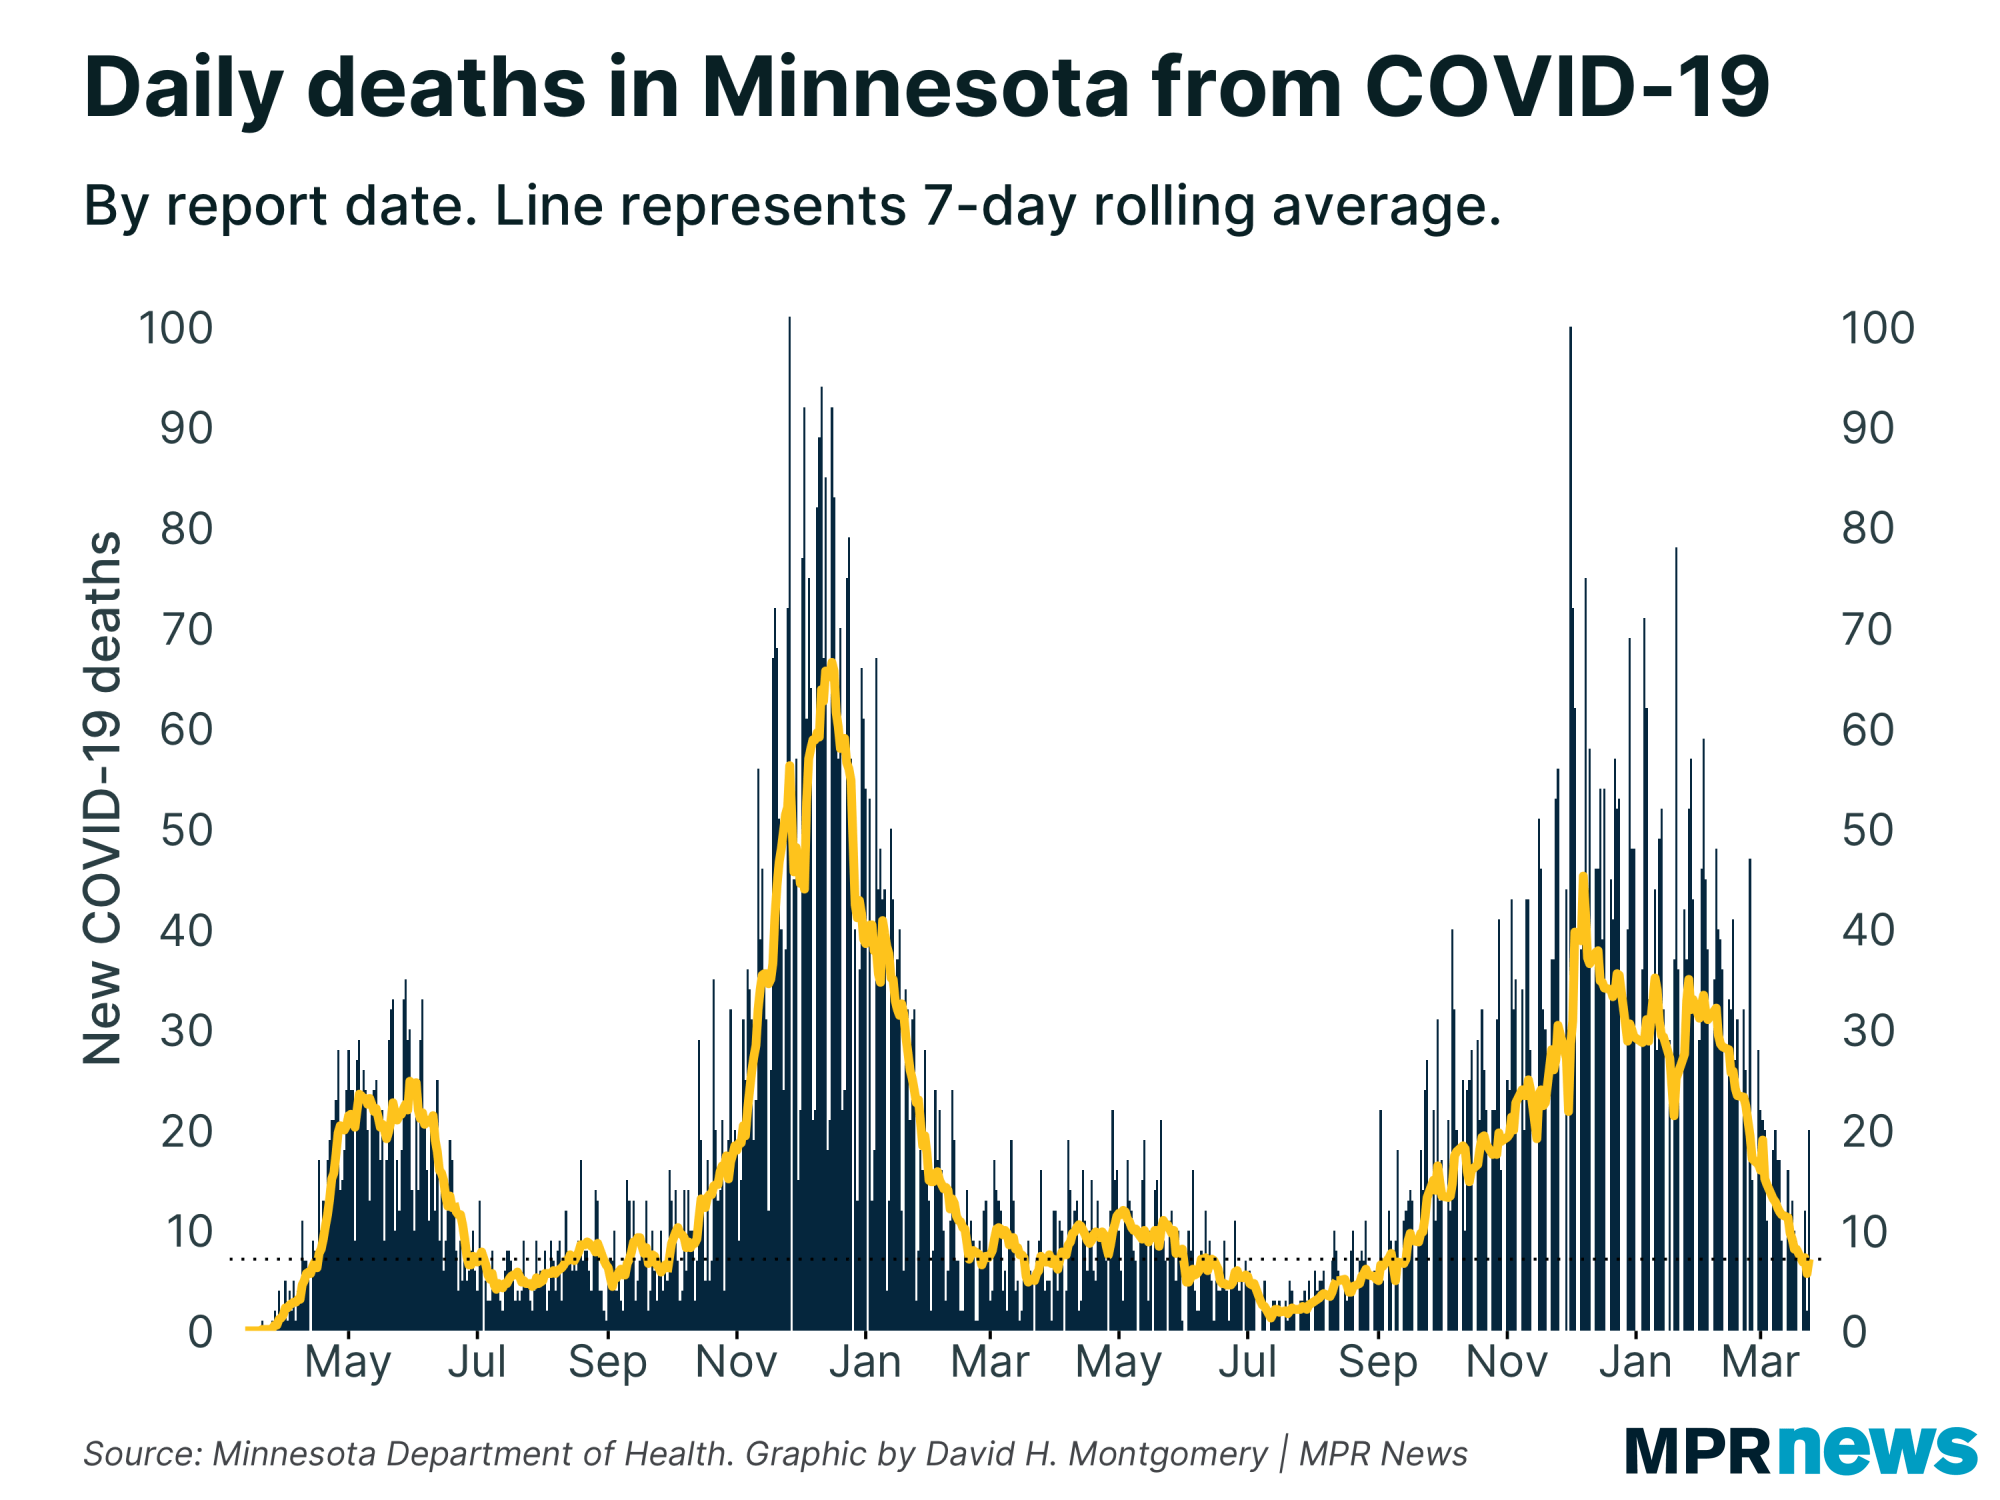
The state's death toll stands at 11,599 including 38 newly reported deaths. Deaths typically follow a surge in cases and hospitalizations. In past COVID-19 waves, it’s been the last of the key metrics to improve.
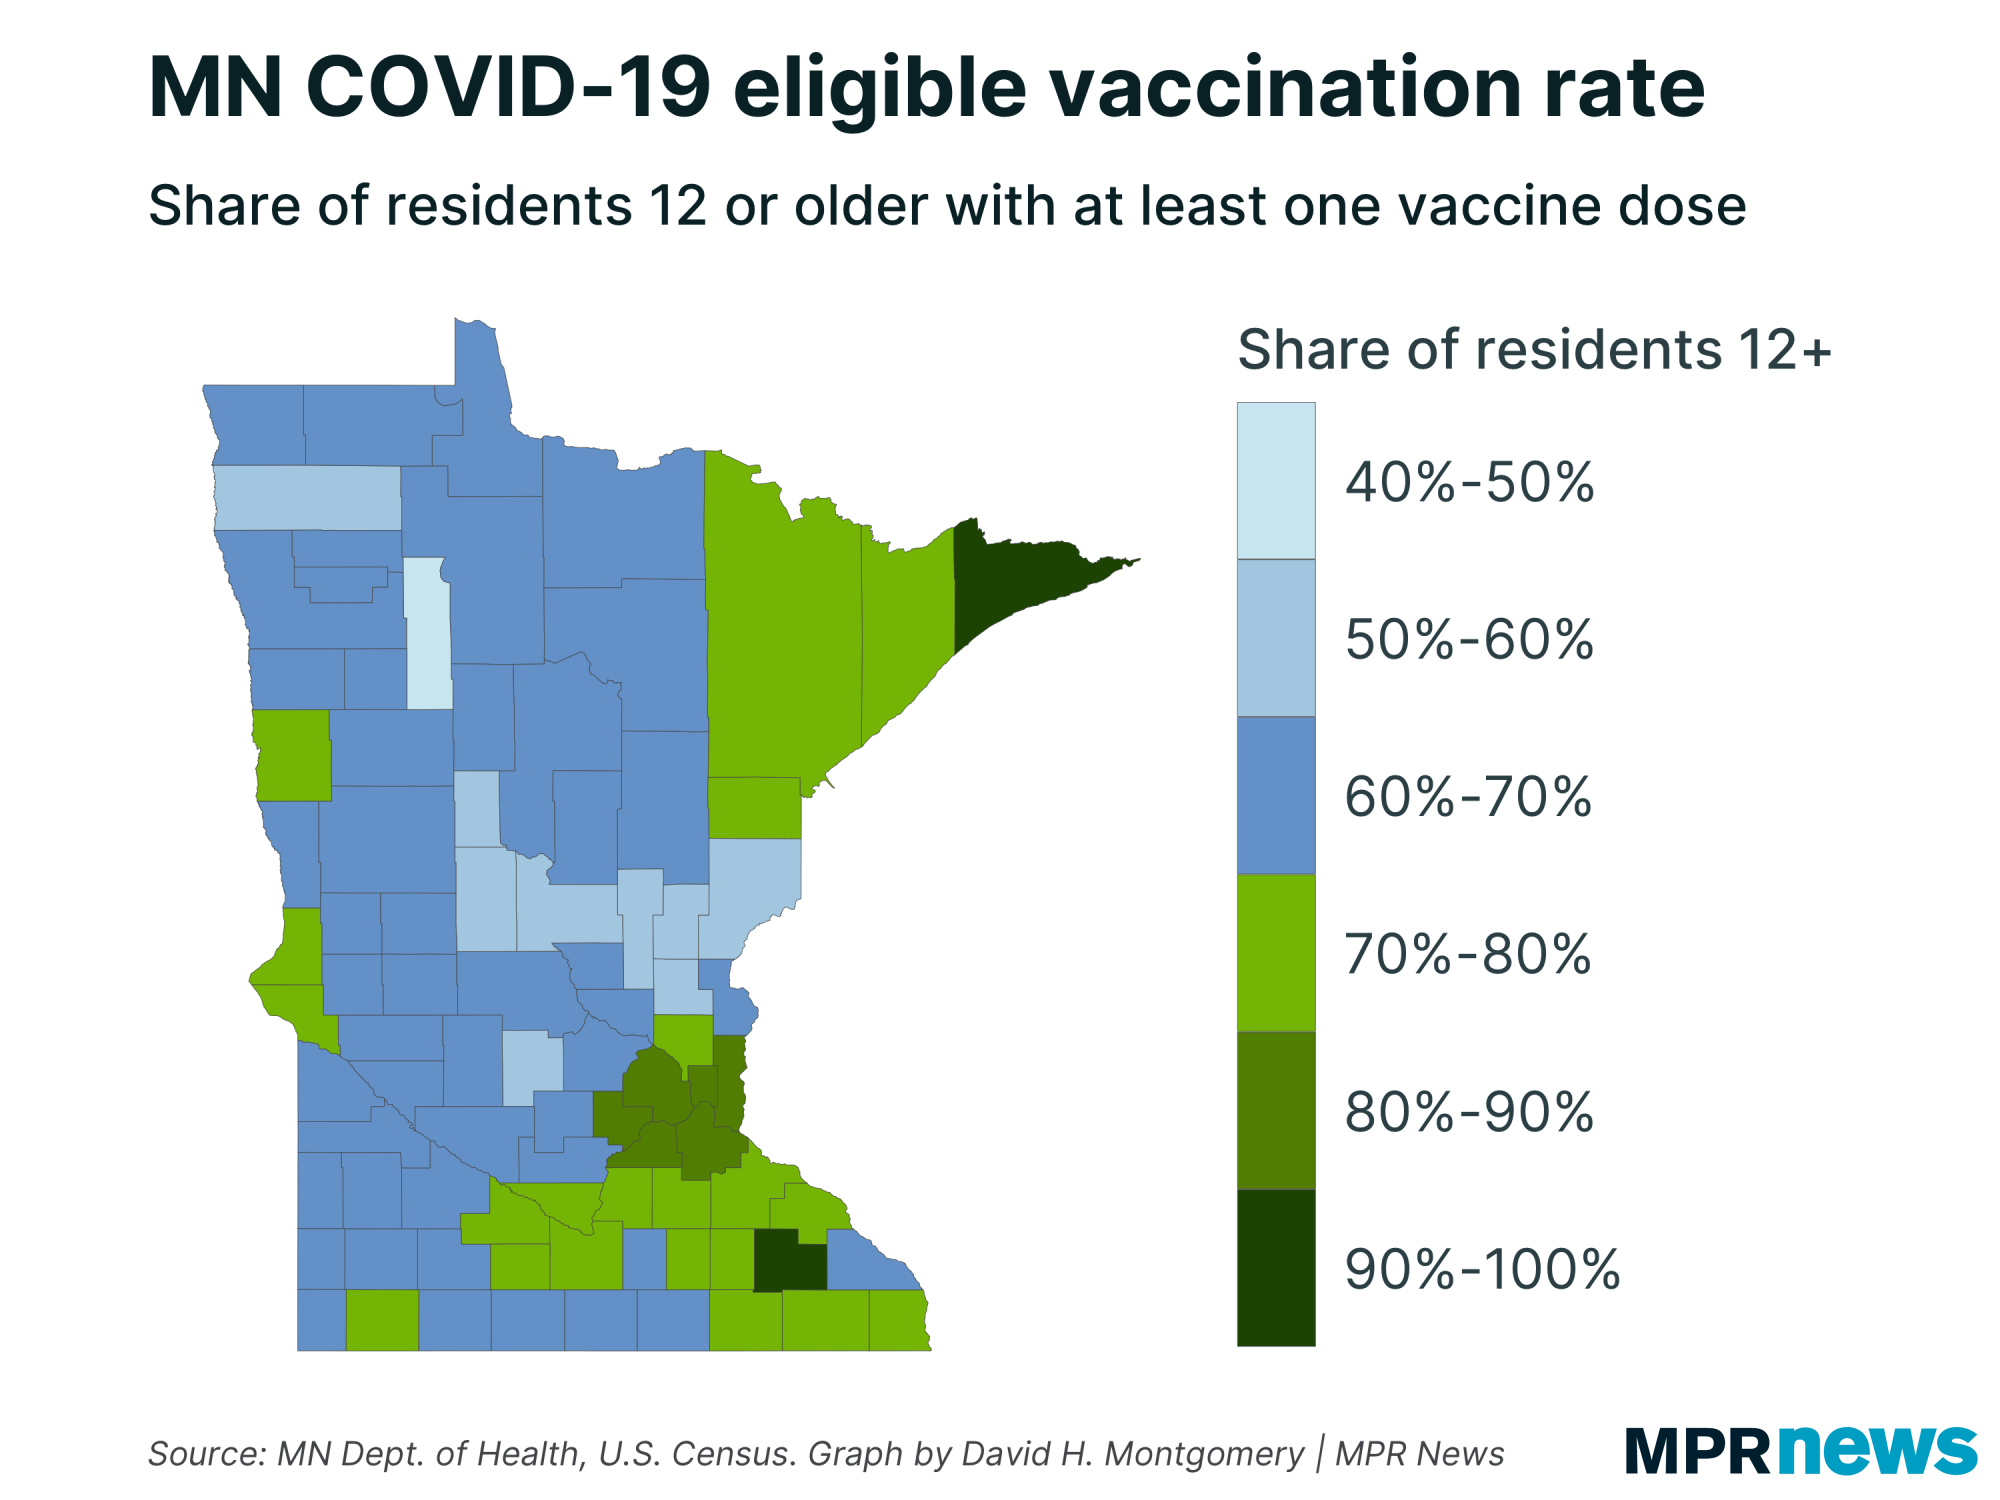
Thanks to vaccinations, Minnesota is better positioned now than during its fall 2020 and spring 2021 spikes: Nearly 78 percent of state residents age 12 and older have received at least one vaccination shot, with more than 73 percent now completely vaccinated.
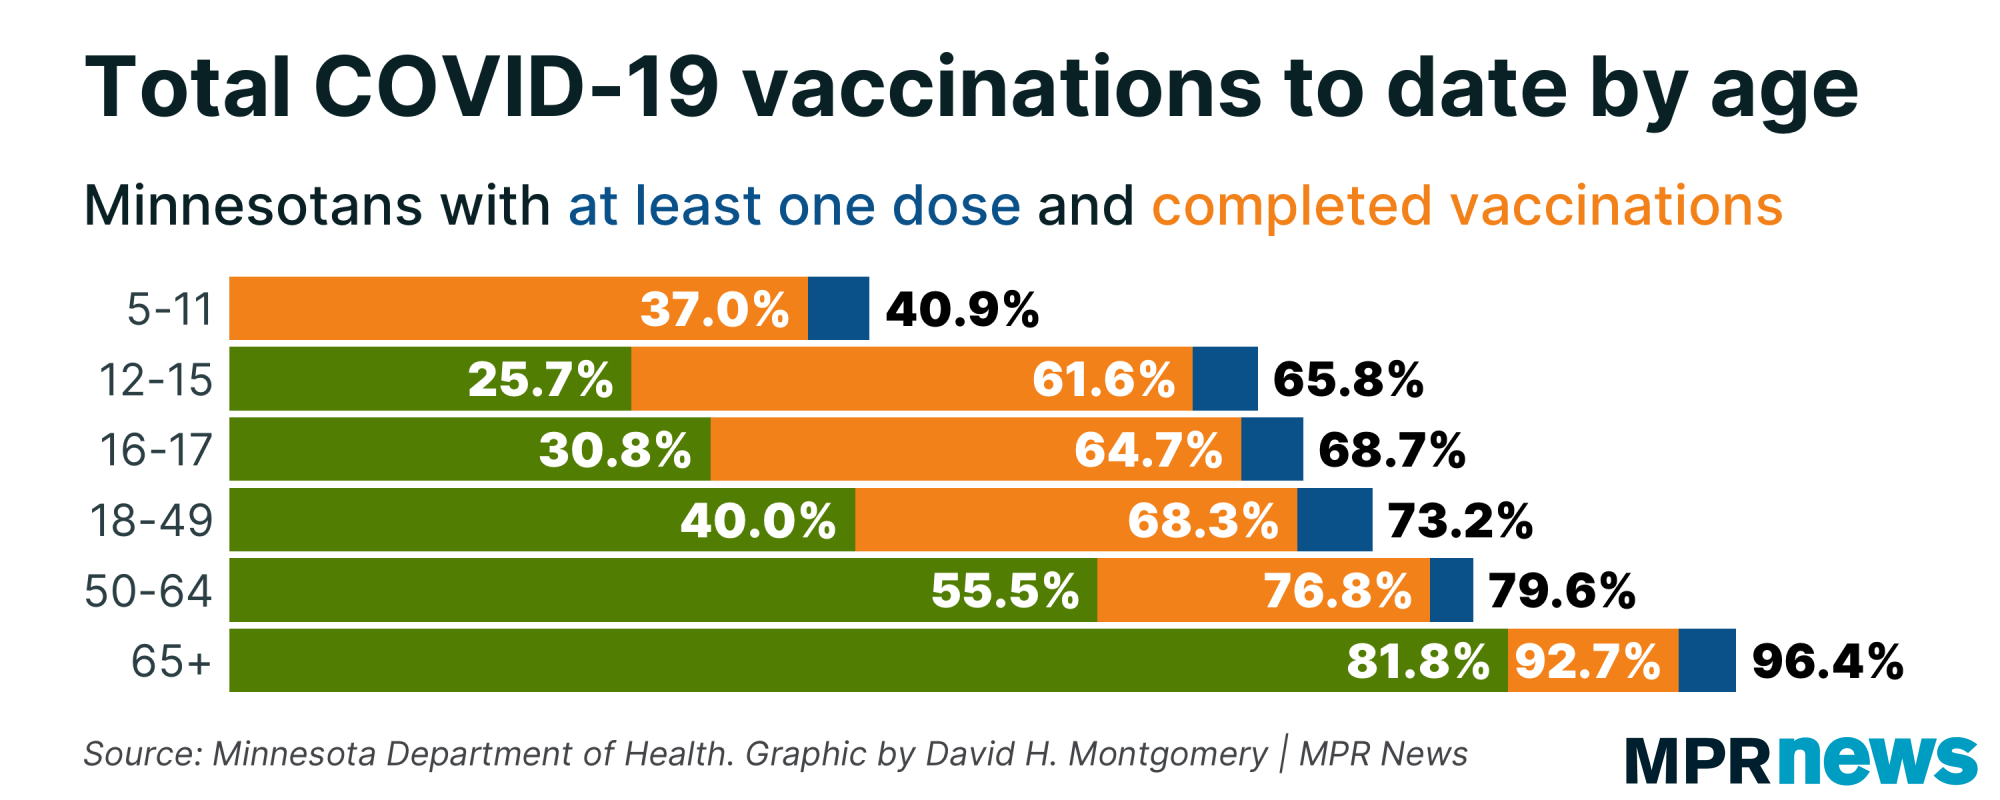
However, the struggle continues to get first shots into more Minnesotans, especially in central Minnesota.